A Banking Crisis Amid the Fed’s Fight Against Inflation
Key Points – A Banking Crisis Amid the Fed’s Fight Against Inflation
- Silicon Valley Bank, Signature Bank, and Credit Suisse Highlight Banking Crisis
- Federal Reserve Continues Raising Fed Funds Rate Despite Banking Crisis
- What Signs Are We Seeing of a Slowing Economy?
- How Much Further Will the Fed Go with Rate Hikes?
- 6 Minutes to Read | 9 Minutes to Watch
The data in today’s article is as of March 29, 2023.
March Was Filled with Economic Madness
Whether it was major bank failures, another 0.25% increase of the Fed funds rate, or 10-year treasury yields falling, March didn’t lack any madness this year. We’ll look at all that and more during our March Monthly Economic Update.
Let’s Talk About the Banking Crisis
There was a lot that happened in March. We’ll do our best to recap it by sharing what the major indices did, what fixed income is doing, and give an outlook the second quarter and balance of 2023. Let’s begin with talking about the banking crisis with the failures of Silicon Valley Bank and Signature Bank and collapse of Credit Suisse. The issues with those banks don’t have to do solely with mismanagement. They’re also correlated with the rapid increase of interest rates.
The Impact of Rising Interest Rates on the Economy
Even with the rapid increase of interest rates, it seems like the Federal Reserve is having a very difficult time with taming inflation. Remember that it takes about 12 months from the time of the first rate hike before it’s felt in the economy. The first rate increase in this series of hikes was on March 17, 2022. We’ve gone from a 0-0.25% Fed funds rate range to a 4.75-5% range after nine consecutive hikes.
The question that we must ask is whether the Federal Reserve is about done raising rates. Are they about done or do they have further to go? Can they kill inflation without crashing the economy?
Why Did Silicon Valley Bank Fail?
The failure of Silicon Valley Bank has headlined the current banking crisis. When Silicon Valley Bank failed, there were a lot of mismanagement issues to sift through. They had the maturity dates on the securities that they owned—U.S. treasuries—way too long with going into a rising interest rate environment.
The bank was going to be forced to sell those longer-term treasuries at significant losses when people started taking money out en masse. They were at significant losses because the average duration was at seven years. That caused them to sell those at significant discounts, which is why the federal government stepped into protect the people holding those treasuries as collateral.
A Big Development within the Banking Crisis
The day before Silicon Valley Bank failed, the 10-year treasury yield was just more than 4%. As that happened, the 10-year treasury yield fell below 3.5% and currently sits around 3.6%. During the same period, the Fed raised interest rates by 0.25%. The short end of the yield curve didn’t get nearly as much attention, and we’ll explain why shortly.
Suffice it to say, the stock and bonds markets thought the Fed would stop raising rates in light of the banking crisis. There’s so much pressure on the financial institutions due to rising interest rates. The markets believed that if there was going to be a hike (which there was one) that it would be the last one of this rising interest rate cycle, but the Fed gave no indication that it would be. We’re hoping that the Fed feels like it has gone far enough, but we shall see.
Let’s give the economic activity that’s going to unfold in the next six to nine months or even 12 months time so we can see the true effects of those aggressive interest rate increases. Now, let’s look at the U.S. treasuries yield curve in Figure 1.
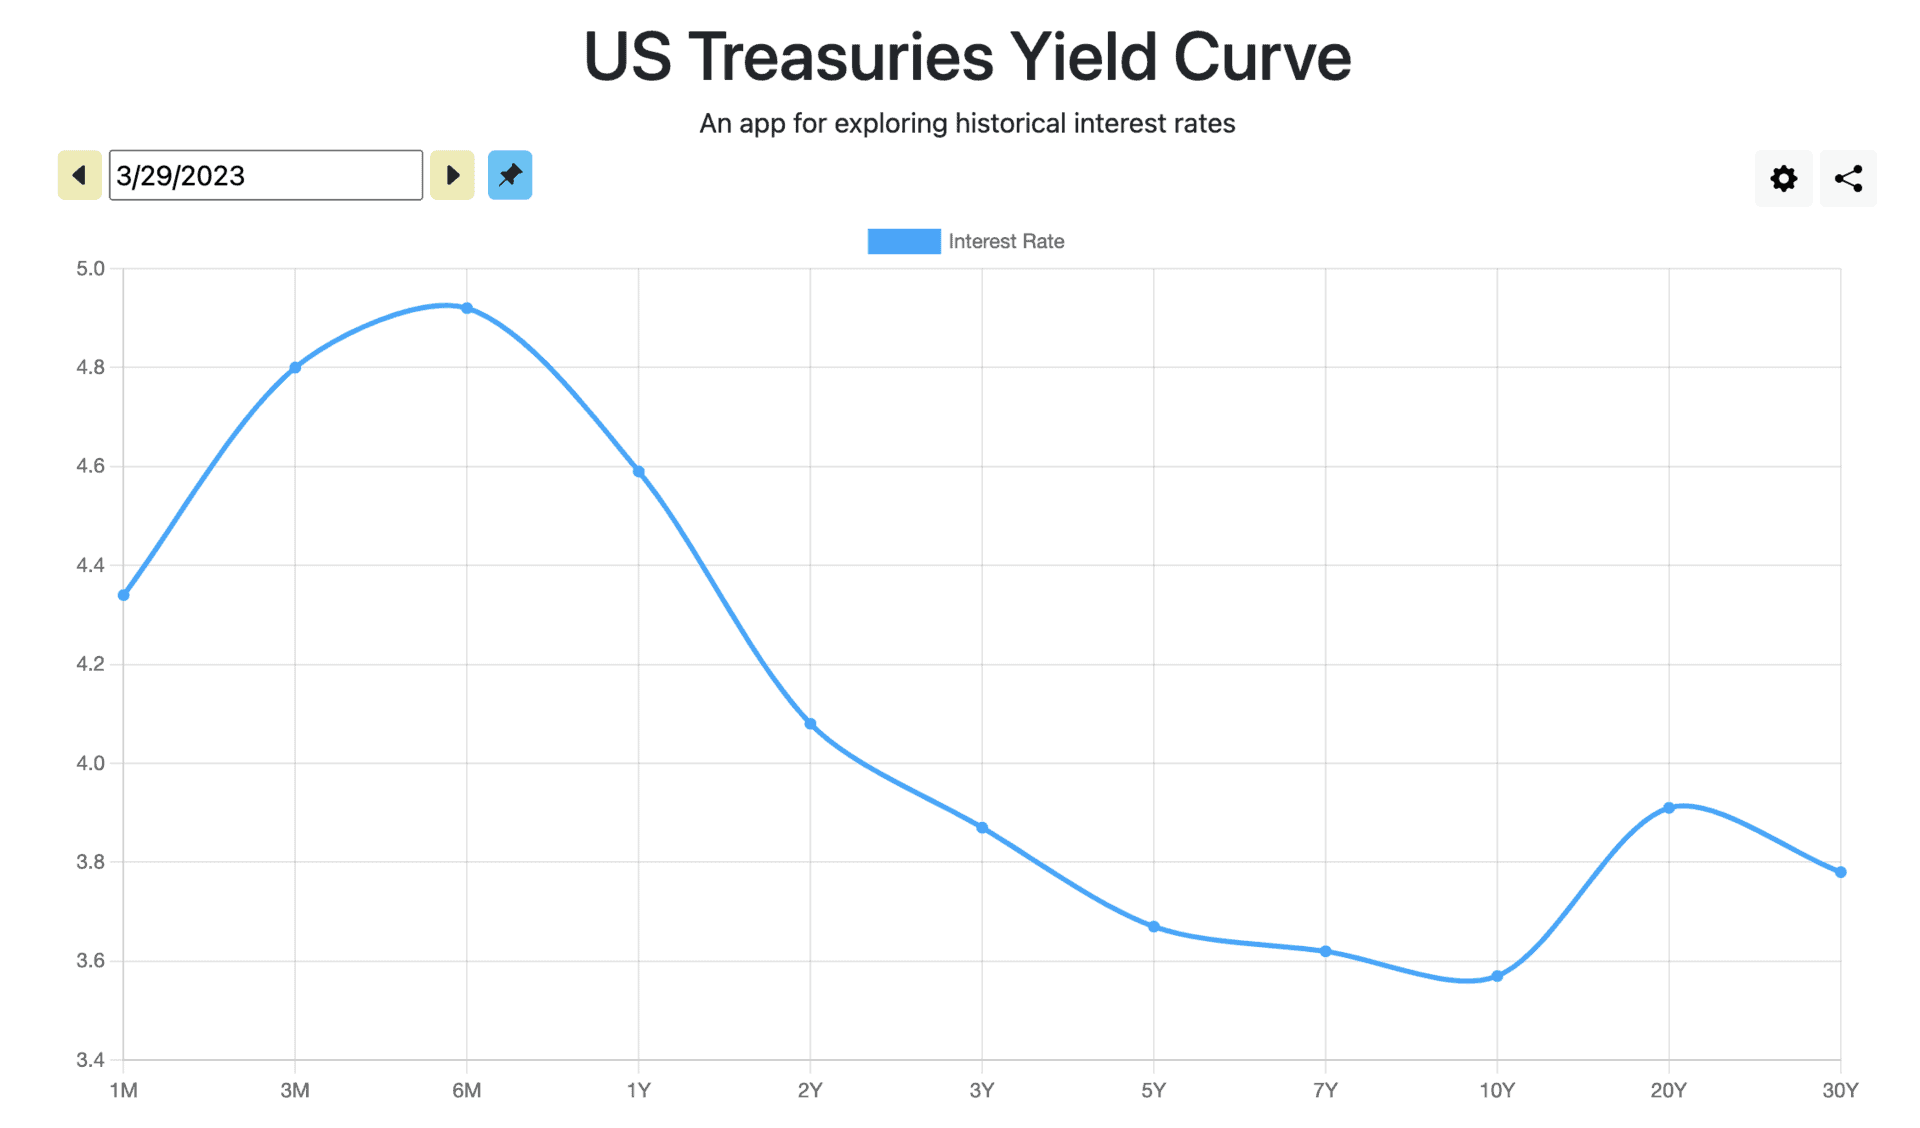
FIGURE 1 – U.S. Treasuries Yield Curve
Signs of a Slowing Economy
We’ve gone over the U.S. treasuries yield curve several times over the past few months. The six-month treasury is giving us the highest yield at 4.9%. The three-month treasury is at 4.8%, while the 10-year treasury is all the way down at 3.55%. We are almost 1.3% higher on the six-month treasury than the 10-year treasury, so this is a very steeply inverted yield curve. Short yields shouldn’t be higher than long yields. The one-month treasury shouldn’t be higher than the 10-year treasury. It’s totally abnormal.
A yield curve that’s this steeply inverted typically signals a recession. The bond market is already very fearful that the Fed has gone too far with rate hikes and that a recession is near (or possibly already here). The bond market’s fears are valid. Every time the yield curve has inverted, a recession has followed. It usually takes about six to 18 months.
Market Performances
We’re starting to see some signs of slowing in the economy, which is good for getting inflation under control. But it could be too far and too fast. The markets kind of liked what happened to Silicon Valley Bank and the banking crisis, thinking that this is the sign that the Fed needs to slow down. Now, let’s look at what happened in March in the major markets in Figure 2.
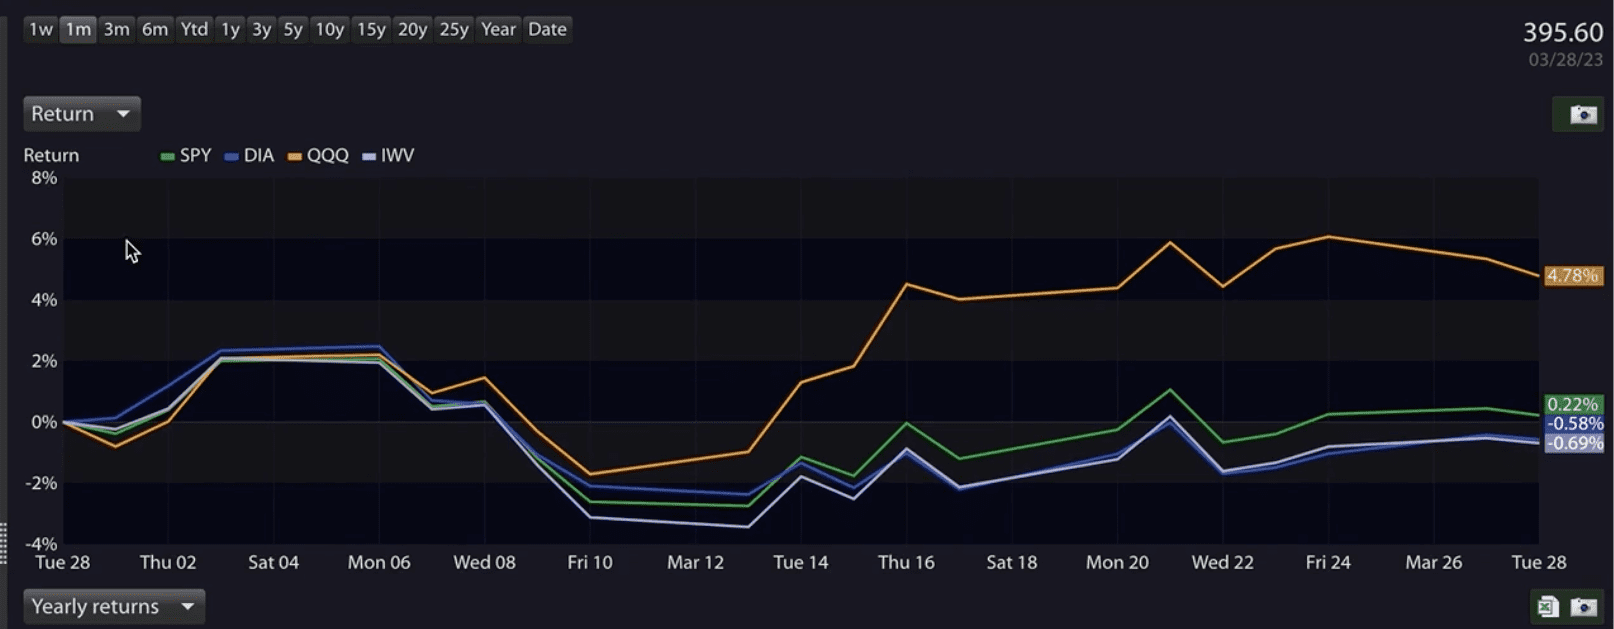
FIGURE 2 – March Market Performances
You can see in the middle of the month where there started to be some trouble with Silicon Valley Bank. The purple line is the Russell 3000. The Dow Jones Industrial Average is in the dark blue and closely mimicked the S&P 500 in green. Then, the technology stocks are in the orange and are growing the fastest. They’re growing the fastest because technology stocks and companies are more growth companies and rely more on borrowing money than some of the bigger companies. Technology stocks got a boost after Silicon Valley Bank failed and the banking crisis took off.
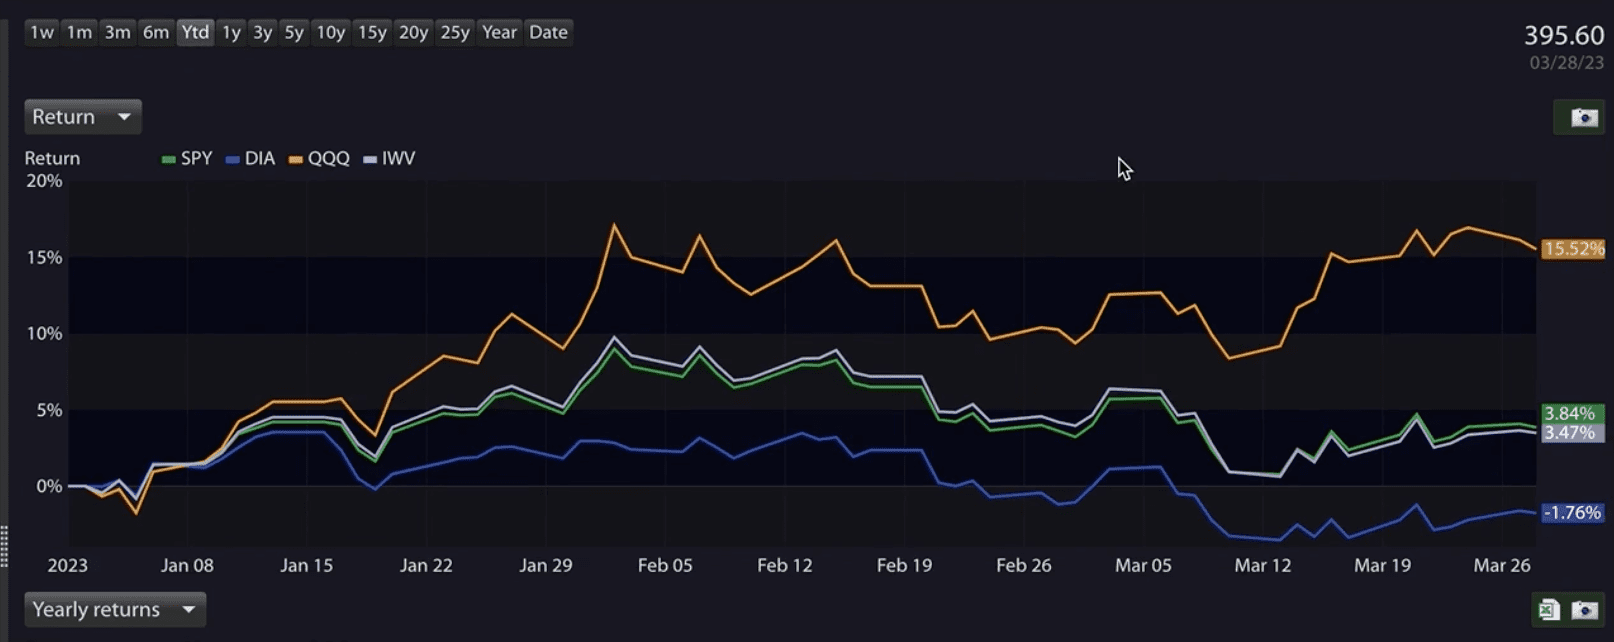
FIGURE 3 – Year-to-Date Market Performances
In Figure 3, you’ll see market performances on a year-to-date basis. The NASDAQ in orange was our top performer, up by 15.52%. The Dow Jones Industrial Average was our worst performer at -1.76%. A lot of that had to do with pressure on energy stocks. The Russell 3000 and S&P 500 were up 3.47% and 3.84%, respectively.
What’s the Next Move for the Fed?
So, where do we head in the second quarter and for the balance of the year? The answer to that question hinges on the actions of the Federal Reserve. If the Federal Reserve says they’re going to pause with the interest rate hikes or even hint at stopping them, that should be an all-clear signal for the stock market. The stock market should rally after that. We’ll eventually get back to the high marks it was at in January 2022, but it’s hard to say how quickly that could happen.
P/E Ratio in the Broad Markets
When you look at the price-to-earnings ratio on the broad markets, it’s supported at different levels based on the risk-free return of the 10-year treasury. When the 10-year treasury was at 1.1% two years ago, the higher price-to-earnings ratios could be supported. As the Fed began to aggressively to the 4.75-5% range where it stands today, it no longer became feasible for the price-to-earnings ratio to be supported.
The markets are close to being fairly valued based on where interest rates are at today. If they’re close to being fairly valued and we want the markets to take off, we need to know that the Fed didn’t go too far too fast and didn’t crash the economy—sending us into a deep recession. If that happens, then the forward-looking earnings of the companies that make up the major indices could disappoint. Therefore, that would keep us in a sideways market.
We’re going to continue keeping an eye on things and will keep you posted with our Monthly Economic Updates. Make sure to keep the lines of communication open with your advisor if you’re a Barber Financial Group client.
Creating a Forward-Looking Financial Plan
For those of you who aren’t Barber Financial Group clients, this is just a small dose of the financial education that we provide. In fact, your investments aren’t the first thing that we want to talk with people about when we first meet with them. Why is that? It’s because we first need to know about your goals for retirement and how you think and feel about money. And then, we must consider taxes, risk management, estate planning—among other things. All that is crucial to a comprehensive financial plan. And having a comprehensive financial plan is crucial to having a successful retirement and having clarity through down times in the markets.
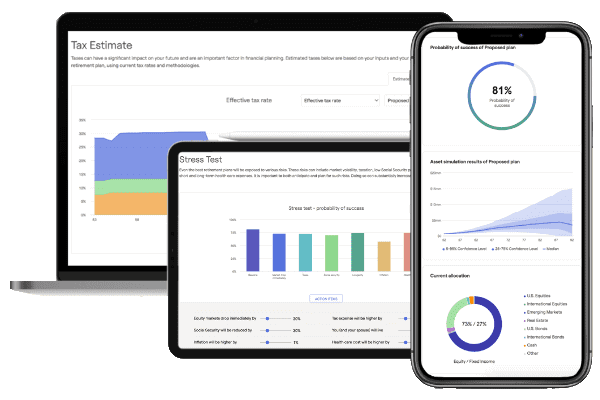
We want to make sure that you have a plan that gives you confidence leading up to and going through retirement. You can begin seeing what that plan looks like for you when using our financial planning tool. This is the same industry-leading tool that our CFP® Professionals use with our clients. To use this tool from the comfort of your own home, just click the “Start Planning” button below.
Working with a Team of Financial Professionals
The economic uncertainty we’ve been mired in for the past year or so can lead people to make emotional financial decisions that can derail their plans for retirement. We obviously don’t want that to be the case for anyone. So, if you have any questions about the banking crisis, the Fed’s fight against inflation, building a financial plan—whatever it may be—we’re here to help. You can ask us your questions by scheduling a meeting with one of our CFP® Professionals. Click here to schedule a 20-minute “ask anything” session or complimentary consultation. We can meet with you in person, by phone, or virtually.
Investment advisory services offered through Modern Wealth Management, LLC, an SEC Registered Investment Adviser.
The views expressed represent the opinion of Modern Wealth Management, LLC, an SEC Registered Investment Adviser. Information provided is for illustrative purposes only and does not constitute investment, tax, or legal advice. Modern Wealth Management, LLC does not accept any liability for the use of the information discussed. Consult with a qualified financial, legal, or tax professional prior to taking any action.