Geopolitical Uncertainty Creates Chaos … And Opportunities
Key Points – Geopolitical Uncertainty Creates Chaos … And Opportunities
- Where Do We Stand in the Geopolitical Risk Index?
- The Latest on the War Between Russia and Ukraine
- Is a Similar Conflict Looming Between China and Taiwan
- The Common Commodities Between the Russia/Ukraine and China/Taiwan Conflicts
- Geopolitical Uncertainty Also Provides Opportunities
- 16 Minutes to Read
No One Likes Uncertainty
Almost everyone on the face of the planet dislikes uncertainty. It makes us uncomfortable and anxious because we don’t know what to expect next. We want to know how much money we’re going to earn each year, how much our bills are going to be, how much we can save, and where we are going on vacation.
Most of us follow the same routine every morning when we get out of bed. And if we don’t, our day starts on a bad note. If we’re playing or watching a game, we want to know what the rules are. When we’re driving, we want to know what the speed limit is (not all of us follow it, we just want to know what it is). We want to know the most direct route and whether we’re going to deal with detours along the way. Whether we admit it to ourselves or not, we like order, routine, predictability, and … wait for it … certainty.
An Abundance of Geopolitical Uncertainty
Today, certainty is in very short supply, especially in the geopolitical realm. We have the least amount of geopolitical certainty that we’ve had in decades. What makes the geopolitical uncertainty even more disconcerting than the normal kind is that we have no control or understanding of what’s going on. Oftentimes, we don’t know why and what it might mean to us in the coming days, weeks, and years.
To fully address everything going on in the geopolitical space today would require more time and space than I’ve got for this article. Nevertheless, I’m going to attempt to give you some context of what’s happening and why. I’ll also explain how the events are currently impacting the economy and your money and how they may continue to do so in the near future.
Where Do We Stand in the Geopolitical Risk Index?
The need to understand and quantify things is an innate characteristic of the human condition. We want to know what “it” looks like. Geopolitical uncertainty is no exception, and believe it or not, there’s an app for that. Not really an app, but a website. Matteo Iacoviello, an associate director in the Division of the International Finance of the Board of Governors of the Federal Reserve System, developed what he called the Geopolitical Risk (GRP) Index, which you can see below in Figure 1.
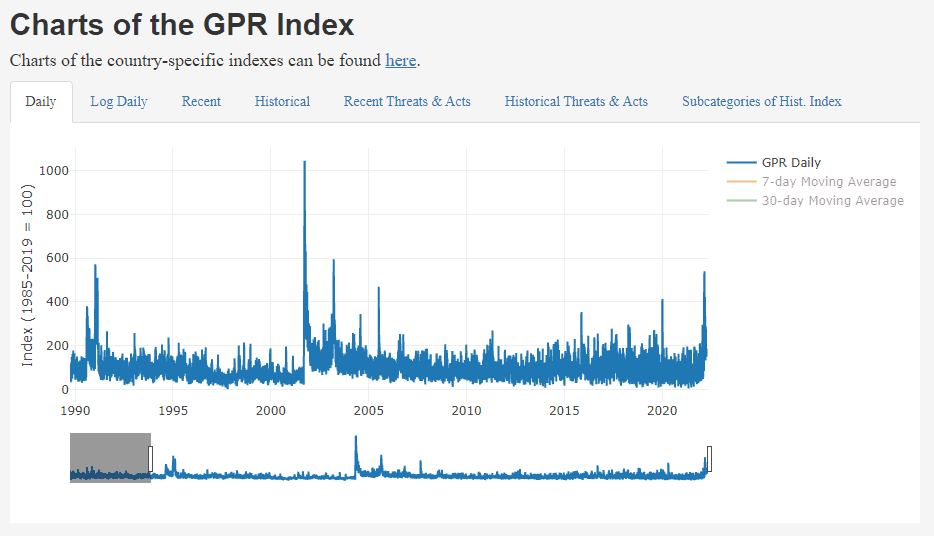
FIGURE 1 – Charts of the GPR Index – Matteo Iacoviello
Since the beginning of 1990, the only time the GPR has had higher readings than it does today was following Iraq’s invasion of Kuwait in August 1990, immediately following the September 11 attacks, and the beginning of the war in Iraq in March 2003. With numbers so elevated, it’s no wonder everyone is on such high alert and wondering what’s going to happen next thanks to all the geopolitical uncertainty.
Getting a Grasp on Geopolitical Uncertainty Using Geography, Geology, and History
So, let’s move on to what is happening and what the experts are afraid of/predicting will happen next. We’ll go through some geography, geology, and history to get a handle on both. We’ll start with Russia and Ukraine.
Russia and Ukraine
Below in Figure 2, you’ll see a map courtesy of NATO. Each NATO country is in a light blue color, so Russia has NATO countries to its east and west.
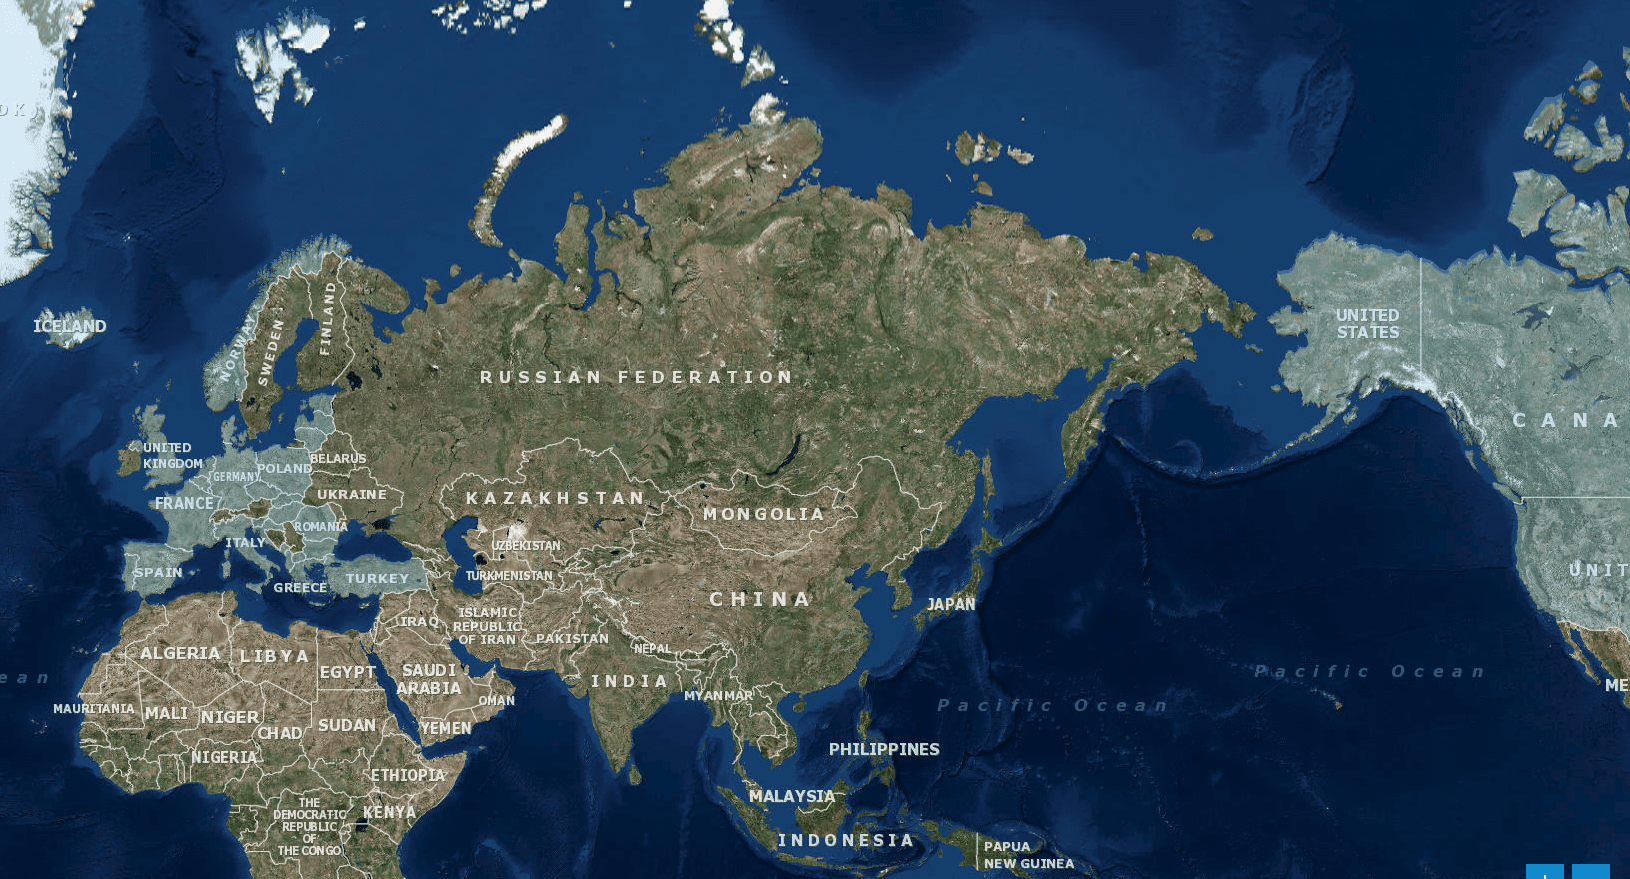
If you zoom in, you can also see Ukraine and Belarus on Russia’s western border. Neither country is a NATO member, and they are the only buffer between their actual border and NATO countries. More on that shortly. Belarus is friendly with Russia and considers itself politically aligned with Moscow. This was also the case with Ukraine up until 2014. That’s when then Ukrainian President Viktor Yanukovych, who was aligned with Russian President Vladimir Putin, rejected a deal for greater integration with the European Union. It resulted in mass geopolitical-related protests across Ukraine.
Yanukovych tried to violently put down those protests, but instead, his government was toppled by the protestors. In turn, he was run out of the country in March 2014. In May 2014, anti-Russian businessman Petro Poroshenko was elected as Ukraine’s fifth president. That wasn’t good news for Putin.
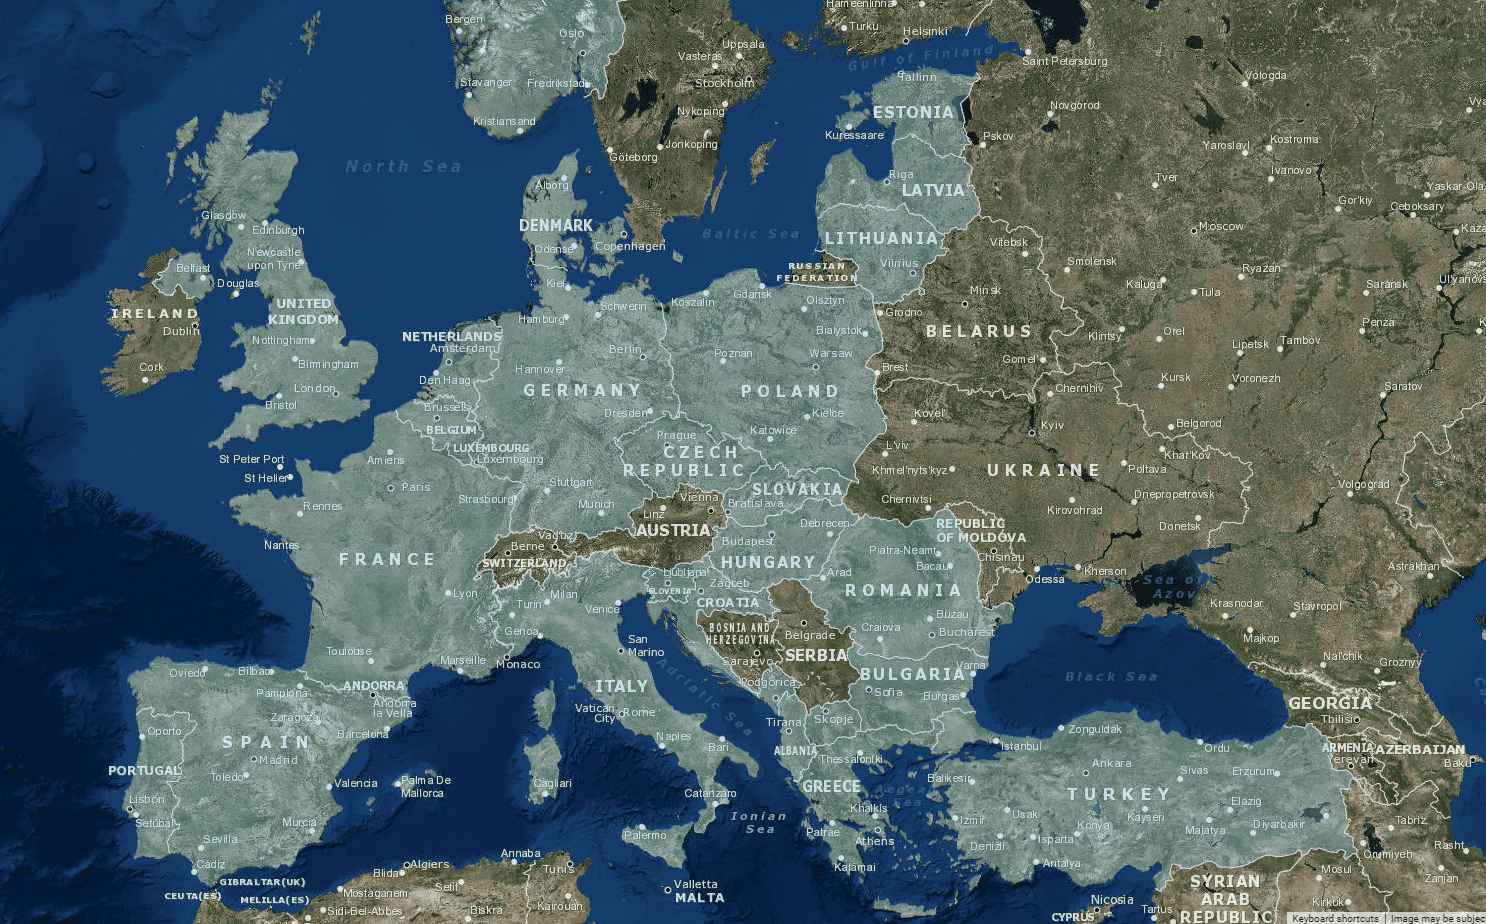
FIGURE 3 – NATO Map European Union – NATO
Ukraine: Russia’s Gas Bridge to Europe
Above in Figure 3, you can see why Putin wasn’t happy that an anti-Russian president had been elected. In the Black Sea off the coast of Ukraine and Crimea, massive reserves of oil and natural gas had been discovered in 2012. Putin wanted to control those resources for multiple reasons. Russia provides a lot of the oil and natural gas used by the European Union and Ukraine. Russia is the second largest producer of oil in the world, ahead of even Saudi Arabia, and has the largest proven natural gas reserves in the world.
Revenues from the sale of these resources compose roughly 50% of the Russian government’s budget and 30% of the country’s GDP. Most of their natural gas is sold to the European Union countries and makes up 35% of the EU’s gas supply. Germany relies on Russia for 50% of their natural gas. All this gas flows to the EU in a complex series of pipelines. Some of those pipelines happen to run right through, you guessed it, Ukraine. It costs the Russians billions of dollars in tariffs to use the Ukraine as a gas bridge to Europe. Russia has sought to fix this problem by building new pipelines (think Nord Stream 1 and 2, just to name a couple) that will eventually eliminate the need to use the one(s) going through Ukraine.
With the reserves around the Crimean Peninsula in the Black Sea (shown below in Figure 4), Ukraine could become not only energy independent, but an energy exporter, and take a lot of revenue away from the Russian government. Lacking the resources to develop those reserves, Ukraine began granting exploration and drilling rights to companies like Exxon and Shell to help. The developed reserves there would make Ukraine the world’s 14th largest producer of oil and gas, and potentially allow them an easy path to entry into the European Union and NATO.
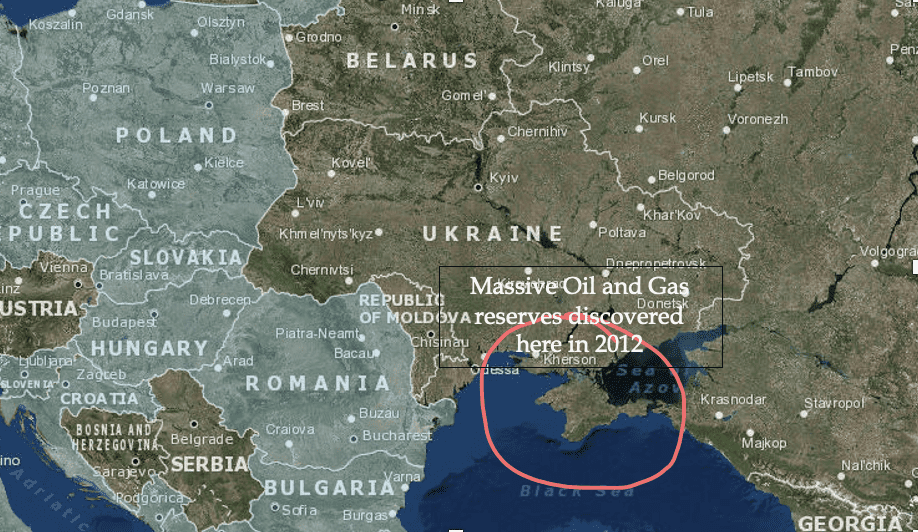
FIGURE 4 – NATO Map Crimean Peninsula – NATO
Putin’s Paranoia
Putin would not stand for that geopolitical outcome. He subsequently invaded, then annexed Crimea later that year, including the surrounding waters which contained most of the newly discovered reserves.
But there’s more to Russia’s interest in the Ukraine than energy. Maybe more important is the geography of Russia and the paranoia of Vladimir Putin. He believes that NATO countries are (or may become) his enemies. Putin will do everything in his power to minimize their presence on his western border.
If Ukraine were to become a NATO member, Russia would have to defend over 1,400 miles of flat difficult to defend land known as the North European Plain that runs from the Carpathian Mountains in the west to the Ural Mountains in the east. Currently, Russia only needs to defend a small area around Latvia, Estonia, and Lithuania that runs from St. Petersburg to Kaliningrad. Russia prefers to keep it that way. With the western countries continuing to discuss the possibility of NATO membership for Ukraine, ignoring the warnings from Putin that he would not set idly by while they put another NATO country on his western border, Putin decided that invading Ukraine was his only option.
The Russia-Ukraine War Rages On
And so, the war that began between Russia and Ukraine on February 24 rages on. Russian commanders told their troops that this would be an operation that would “be over in 72 hours or less.” The Ukrainians had other ideas about how things would turn out and have vehemently defended their nation for the last two months. Putin won’t withdraw and the Ukrainians won’t give up, so there’s no end in sight for this geopolitical-fueled conflict.
The war will undoubtedly disrupt the agricultural production of both countries, especially Ukraine, as their farmers have taken up arms against the Russian invasion. The war has already directly or indirectly affected the price of all sorts of commodities through port closures, sanctions, and embargos. We’ll discuss those impacts a little later in the article.
What’s Going on Between China and Taiwan
While the Russia and Ukraine conflict rages on, many analysts have wondered whether this event and the worldwide reaction to it might be viewed by China as an opportunity to do something that they’ve long desired…invading and claiming as their own…Taiwan. It’s a reasonable geopolitical question to ask and one worth exploring.
Let me say at the outset that I hope that China DOESN’T invade Taiwan! What we need to consider, though, is why they WOULD.
There are two common themes in every major conflict that has ever arisen throughout human history—border or territory security and resources (protection of or procurement of). Both are present in the Russia-Ukraine conflict and in the potential China-Taiwan conflict.
The History Between China and Taiwan
To understand the border security issue, let’s look at the map below in Figure 5 and see what it can tell us. It’s also important to understand, as most of you already do, that Taiwan is an independent nation state which China has claimed as part of the Republic of China for the last 70 years.
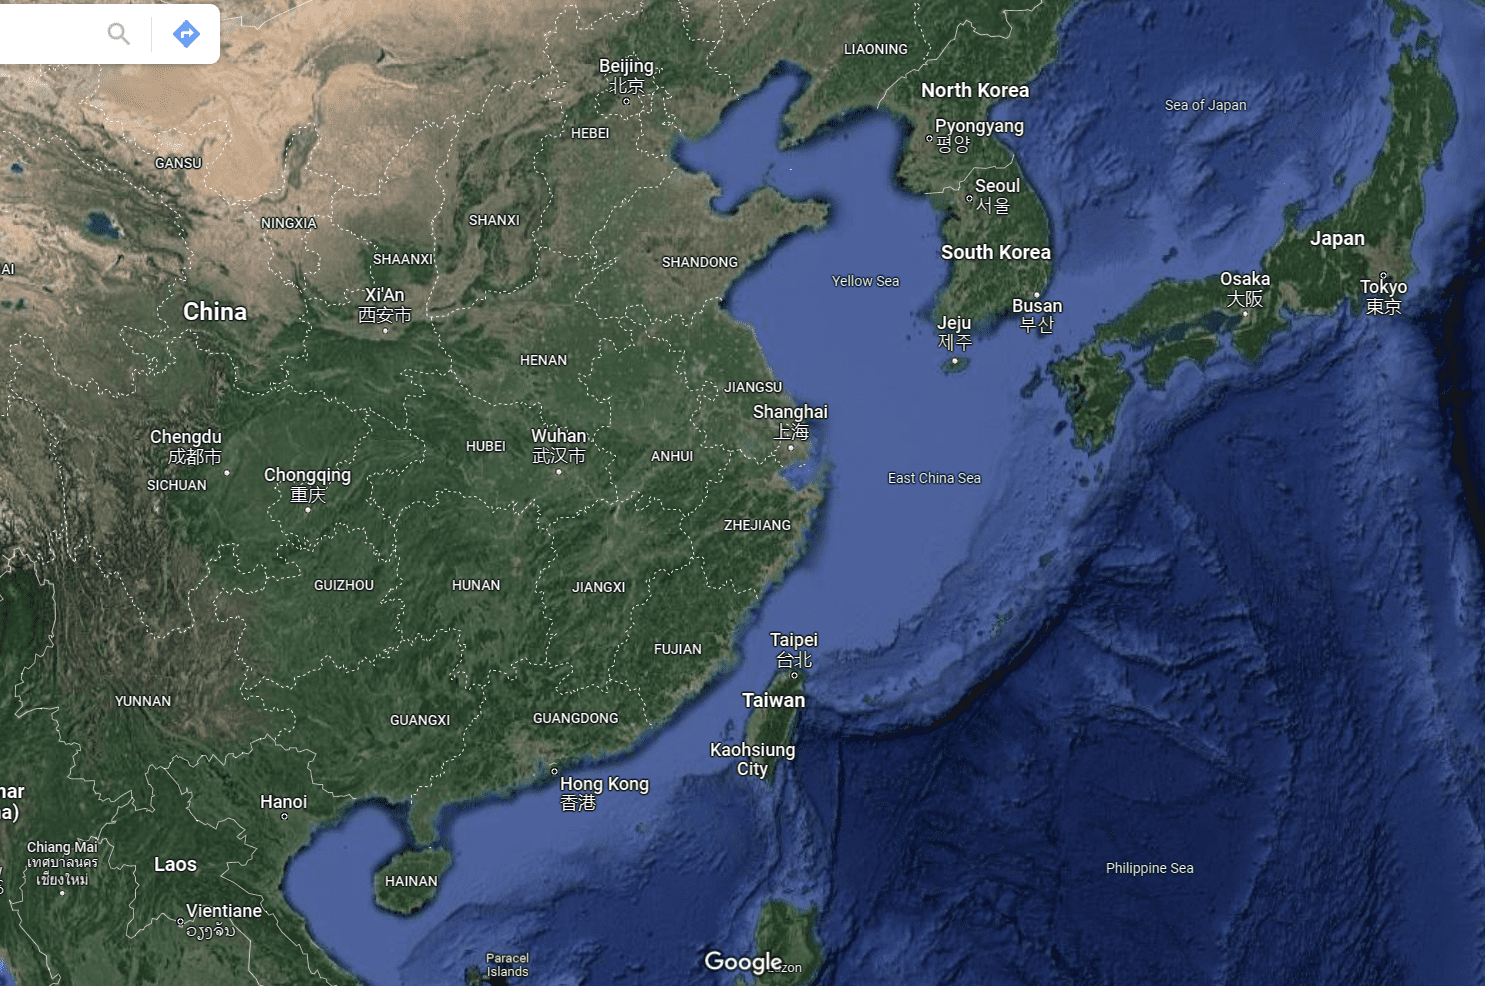
FIGURE 5 – NATO Map China and Taiwan 1 – NATO
The reality is that, like Hong Kong, Taiwan is much more closely aligned with western free market principles. Taiwan has experienced rapid economic growth, as it is now the 21st largest economy in the world. What’s more is that Taiwan sets directly off the coast of China and in is the path of most China ship traffic. As shown below in Figure 6, Taiwan is only 100 miles off the China coast. That’s just 10 miles further than Cuba does from Florida.
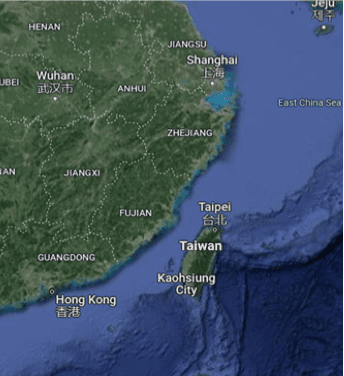
FIGURE 6 – NATO Map China and Taiwan 2 – NATO
China’s Chief Geopolitical Concerns
China’s geopolitical concern is that a truly independent Taiwan, aligned with the west, would undoubtedly become a home for a U.S. military base, a naval port, weapons storage, and troops. Those things are already in place just up the water in Japan and just across the Yellow Sea in South Korea. China doesn’t like that either.
To China, a U.S. military presence in Taiwan is the equivalent of what Russia establishing the same things in Cuba would be to the U.S. They will never intentionally allow that to happen, nor will we, and no one can blame either of us for that.
China doesn’t care about Taiwan or its people. China doesn’t even care if Taiwan is ever unified with them. What China mostly cares about the border security that a not-entirely-independent Taiwan provides. One thing to keep in mind is that China is in the beginning of what may be the biggest real estate bubble bursting ever. It could decimate their economy. If that happens, China will need additional sources of revenue to make up for the collapsing real estate values that are likely coming. That may be another factor in whether they take the leap and physically take over Taiwan.
The Importance of the Taiwan Semiconductor Manufacturing Company
You see, Taiwan Semiconductor Manufacturing Company is conveniently located on the island of Taiwan. It’s the world’s largest contract chip manufacturer and Asia’s most valuable listed company, worth about $600 billion. Much of the supply chain of semiconductors for the world is dependent on Taiwan. China is no exception. In fact, China is Taiwan’s biggest export partner. China buys twice as much from Taiwan as their next largest partner, the United States.
Currently, Taiwan has China in a proverbial chokehold over semiconductors. China spent more money on semiconductor imports in 2020 than they did on oil imports, leading some to speculate that they may be hoarding chips. But that would never happen. Right? Would it? Well, maybe, since China is at LEAST a decade away from being self-sufficient when it comes to semiconductor manufacturing.
The Worldwide Chip Conundrum
And the chip saga isn’t just a Taiwan/China issue. It’s tied back to Russia and Ukraine. Taiwan immediately stopped exporting chips to Russia upon their invasion of Ukraine.
Here’s an excerpt from an article by Investment Monitor Senior Reporter Lara Williams that highlights the geopolitical issue.
Russia can still import low-end chips from China, but it is the high-end chips that are critical for emerging technologies (AI, quantum computing, augmented reality applications).
“High-end chips are also vital for today’s advanced weapons systems and for high-end smartphones, for example,” GlobalData Analyst Michael Orme said. “Everything else can be done by chips supplied by China.
One possible repercussion of this new iteration of chip wars may be a battleground of manufacturing materials. Ukraine is the world’s main supplier of neon gas and Russia is a key supplier of palladium, both of which are used in chipmaking.
As of this writing, palladium prices are down 13% over the last 12 months. The TSMC has indicated that it has plenty of “safety stocks” of neon gas and doesn’t see any issues with the supply chain in the near term. That’s good considering that neon gas prices have increased by 500% since December. Oh, and neon gas is also used in laser eye surgery. So, yeah, it might be more expensive for a bit.
The Common Commodities in the Russia/Ukraine and China/Taiwan Conflicts
Therefore, China invading Taiwan to secure its border, gain unfettered access to high-end chip manufacturing technology, and cash flow from the largest contract chip manufacturing company in the world logistically makes sense. It’s morally and ethically reprehensible, but trust me, China President Xi Jinping doesn’t think in those terms. Nor does his buddy Putin.
The common theme among these four countries and their conflicts is commodities. They all need them, they all produce them, they all export/import them, and they’re all interdependent for several of them. So, how is this playing out in the world of commodities prices? Let’s look.
No Lack of Lithium in China
All those electronic devices that the semiconductor chips make work require electricity. Most of them are portable, which means they require batteries to power them on the go. Today’s batteries are typically made from lithium, a majority of which is produced in China. In Figure 7, you’ll see that lithium carbonate is up 74% in 2022 and up 436% in the last year.
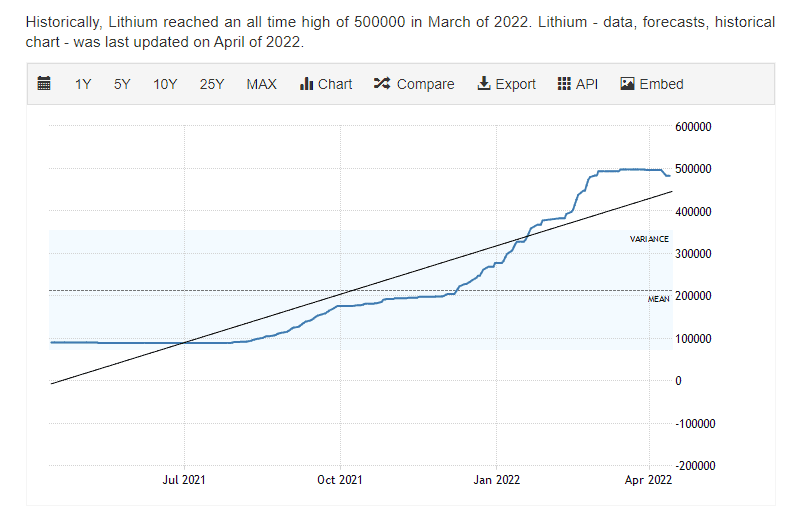
FIGURE 7 – Lithium Value – Trading Economics
Lithium carbonate prices in China eased to 482,500 yuan or $75,645 per ton in mid-April. Fresh output data showed lithium carbonate production in China increased 42% year over year and 41% month over month in March. Higher production increments for salt lakes and improved capacity levels for miners boosted the output.
Still, carbonate prices surged 74% year-to-date, as rising energy prices strengthened the appeal to transition away from fossil fuels, adding to the booming demand for electric vehicles. After rising 157% to 3.2 million units in 2021, electric vehicle sales in China are expected to cross 5 million in 2022.
Also, Deloitte forecasts a 29% compound annual growth in electric vehicle sales, totaling 32% of new car sales by 2030. At the same time, Chinese lithium inventories remain low. Difficulties finding new sources or developing new technologies to source lithium from brines leave producers unable to match higher demand.
The Future of Lithium Lies in … Nevada?
China currently controls 80% of the world’s lithium production, but there are several companies in the U.S. looking to change that in a big way. It’s believed that the largest deposit of lithium in the U.S., and possibly the world, is in Nevada. And, with global demand for lithium projected to grow by 4,000% over the next 20 to 30 years, you can bet there’s someone here in the U.S. that will capitalize on that opportunity.
Waving Goodbye to the Temptation of Buying a Contract of Wheat
Next up, we’ll look at wheat. Chicago wheat futures eased to $11 per bushel from the four-week high of $11.1 touched on April 12. That snapped a three-day rally following projections of higher export projections from India. This is illustrated below in Figure 8.
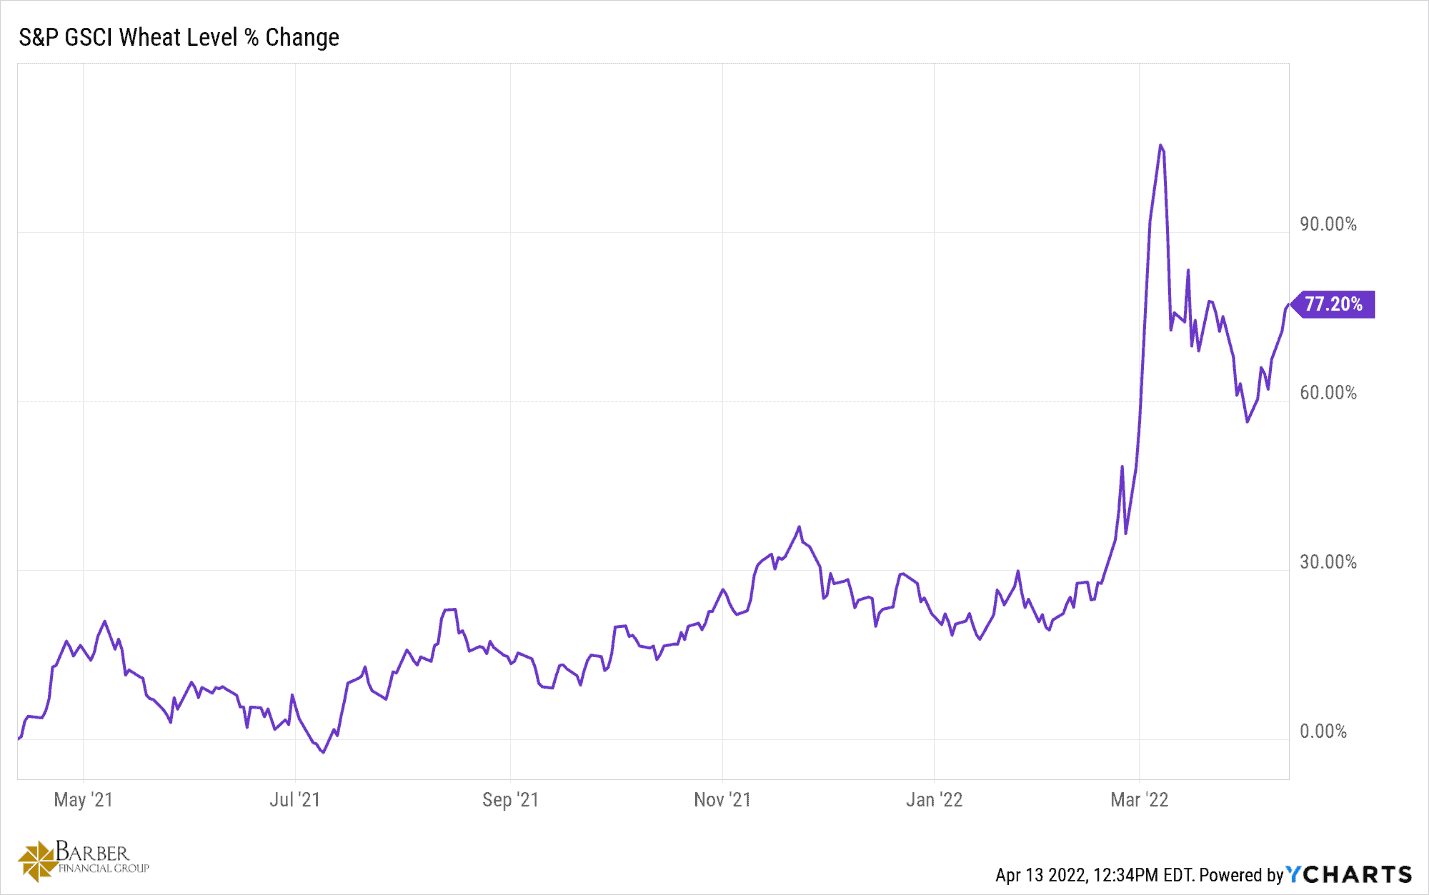
FIGURE 8 – Wheat Value – Trading Economics
A large harvest, sufficient stocks for the government’s welfare program, and higher grain prices led private growers to have a large wheat surplus available to export. That has eased shortage fears due to the war in Ukraine.
Wheat prices are 30% higher than before Russia’s invasion. Data from the UN’s FAO indicated that Ukrainian wheat production is expected to significantly fall in 2022, with at least 20% of winter plantations not being harvested due to direct destruction, constrained access, or lack or recourses to harvest the crop. Also, a declining economy and shortages of agricultural inputs is expected to negatively impact Russia’s output.
The biggest wheat producers are China, India, Russia, the U.S., France, Australia, and Canada. Russia is the biggest exporter of wheat, followed by the United States, Canada, France, Ukraine, Australia, and Argentina. Ukraine and Russia accounted for nearly 30% of global wheat exports before the Russian invasion of Ukraine, though their combined wheat production makes up less than 20% of global production.
This minimizes the chances that the breathless prognostications of worldwide food shortages will become a reality. Prices will suffer, to be sure, but if the crops of both countries were to completely fail to reach the market this year, it would NOT be catastrophic by any definition of the word. So, rest easy, and resist the temptation to have a contract of wheat delivered onto your driveway.
Cotton Uncovers Another Aspect of Geopolitical Uncertainty
Moving on to cotton. Below in Figure 9, you’ll see that cotton futures traded around $138 per pound in April. That was down from an almost 10-year high of $142 hit in late March, as investors ditched some long positions following a slightly bearish WASDE report.
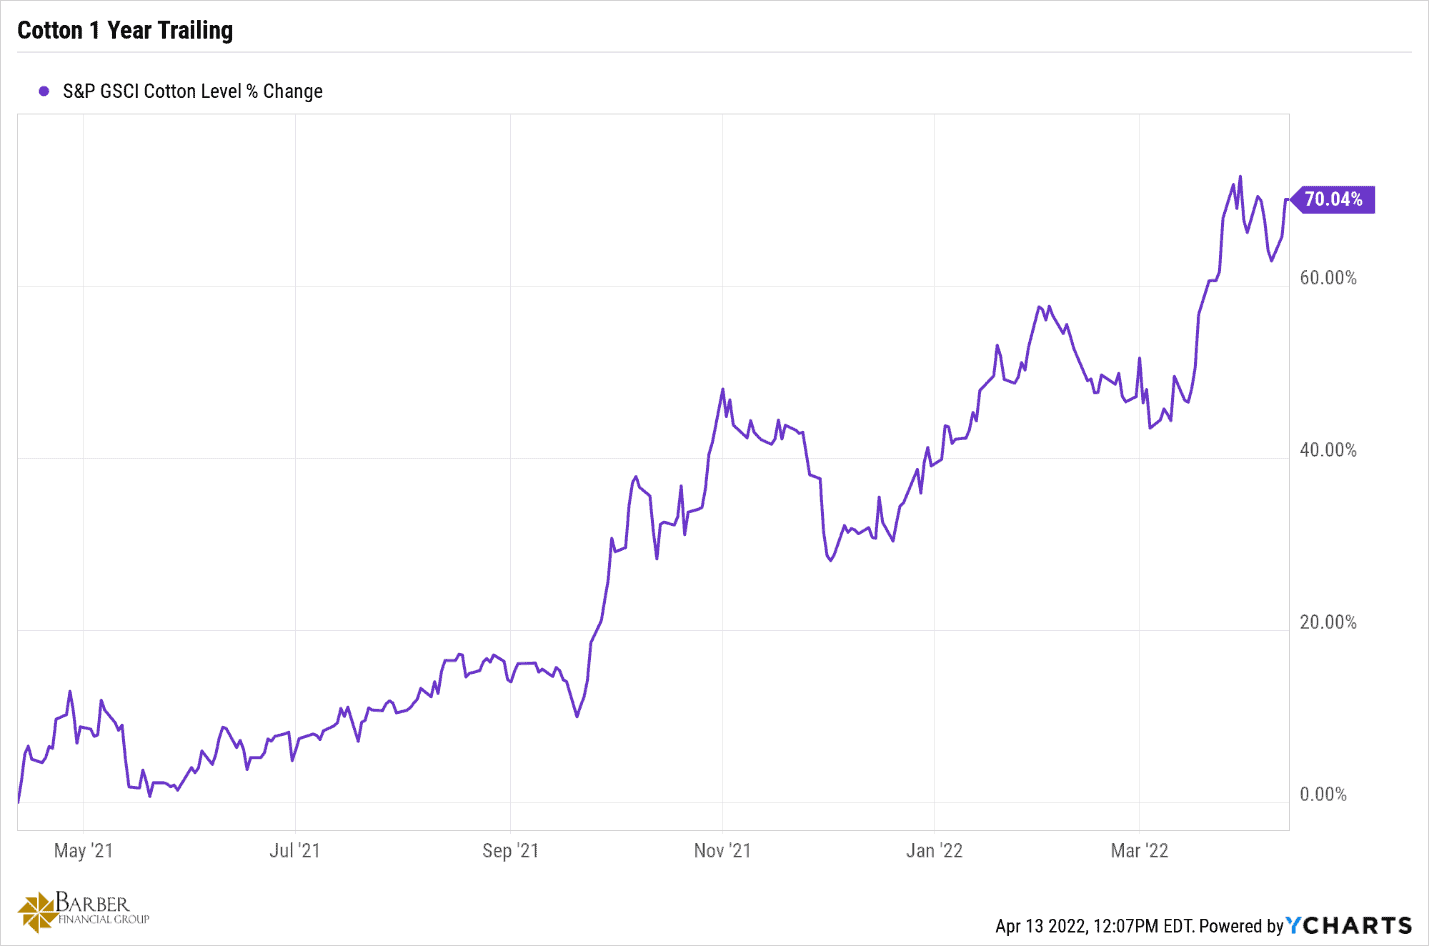
FIGURE 9 – Cotton Value – YCharts
The USDA now projects global production 340,000 bales higher with increases for Pakistan and Greece. Adding to the bearish tone, a 500,000-bale decline in China’s expected consumption resulted in a similar reduction in the worldwide estimates, which now stand at 124.1 million. Still, fundamentals in the cotton complex continue to be supported by expectations of lower domestic supplies due to drought in the U.S. planting areas and the rising cost of fertilizers…
The biggest producers of cotton are China and India, followed by the United States, Pakistan, Brazil, Australia, and Uzbekistan. The United States is the biggest exporter of cotton (40% of total exports). Cotton is the world’s most widely used natural fiber for clothing.
The increases in the price of cotton doesn’t have as much to do with the conflicts as the other commodities, but they point to some geopolitical uncertainty nonetheless. China has adopted a brutal, and now violent, zero COVID lockdown policy that has hundreds of millions of people locked in their apartments and homes indefinitely. High voltage wires keep them in, and armed police and military punish those who manage to escape through the wires without electrocution. Hence, the expected decline in Chinese cotton consumption for this year.
And Then There’s Oil
Oil is the life blood of the global economy. It’s important to understand what’s been happening with the price of oil over the last 15 months or so. Let’s first look at the price of oil before the Russia Ukraine conflict. Figure 10, below, shows the price of oil from November 2020 to November 2021. In those 12 months, the price of West Texas Intermediate Crude (WTI) increased by 124.1%.
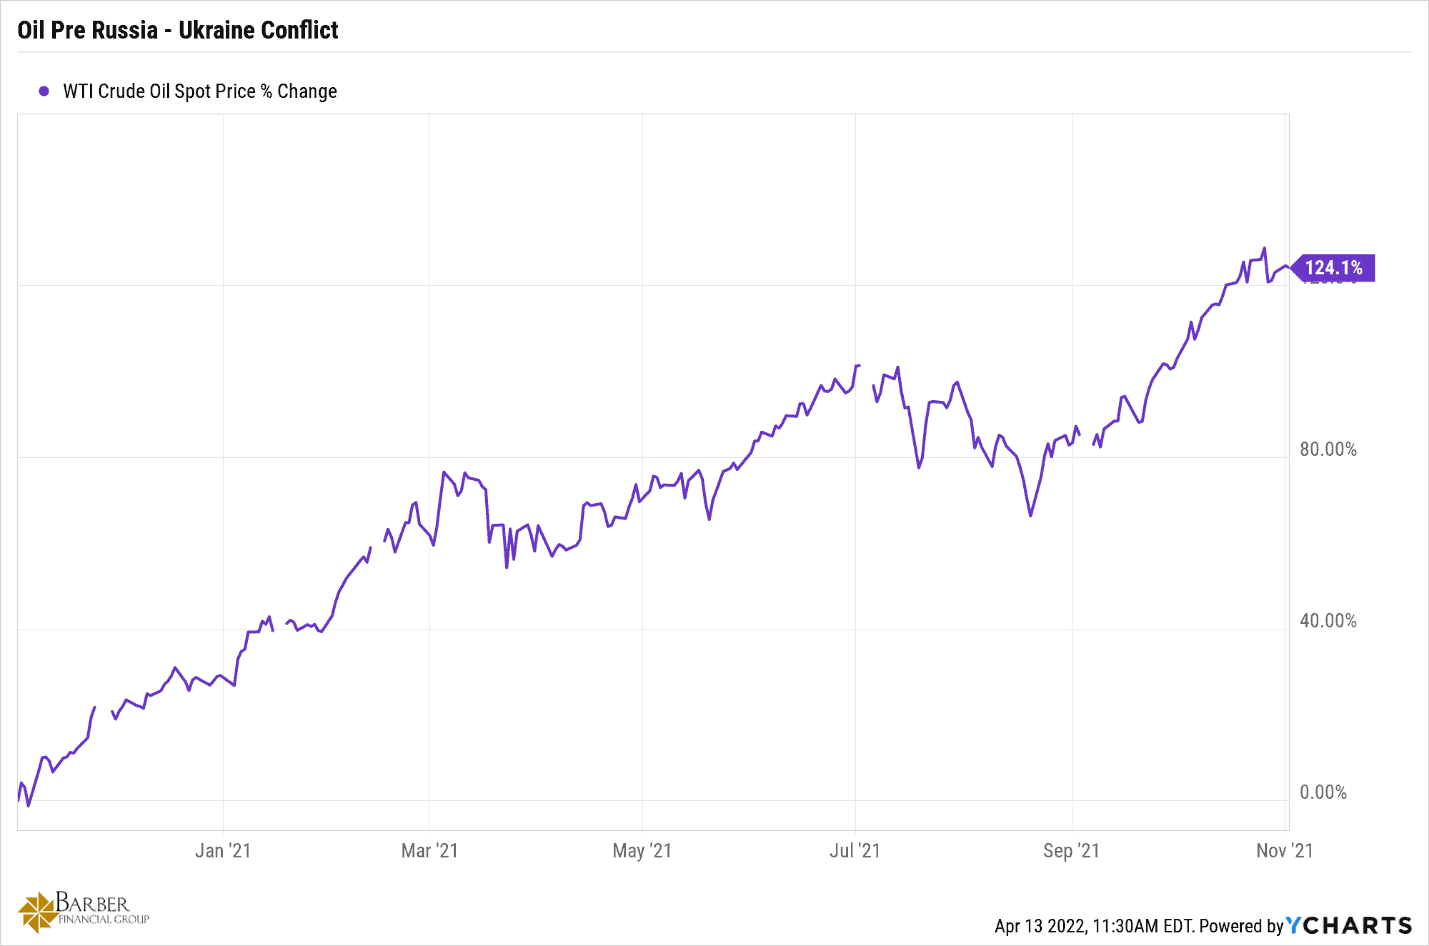
FIGURE 10 – Oil Value Pre Russia/Ukraine Conflict – YCharts
On the flip side, Figure 11 outlines oil performances since the beginning of 2022 and the jump since the invasion. Is it any wonder that things are getting more expensive? Nothing gets to the market without oil. And the cumulative 184.23% jump in the price of oil in the last 16 months is undoubtedly having an impact on the prices of EVERYTHING.
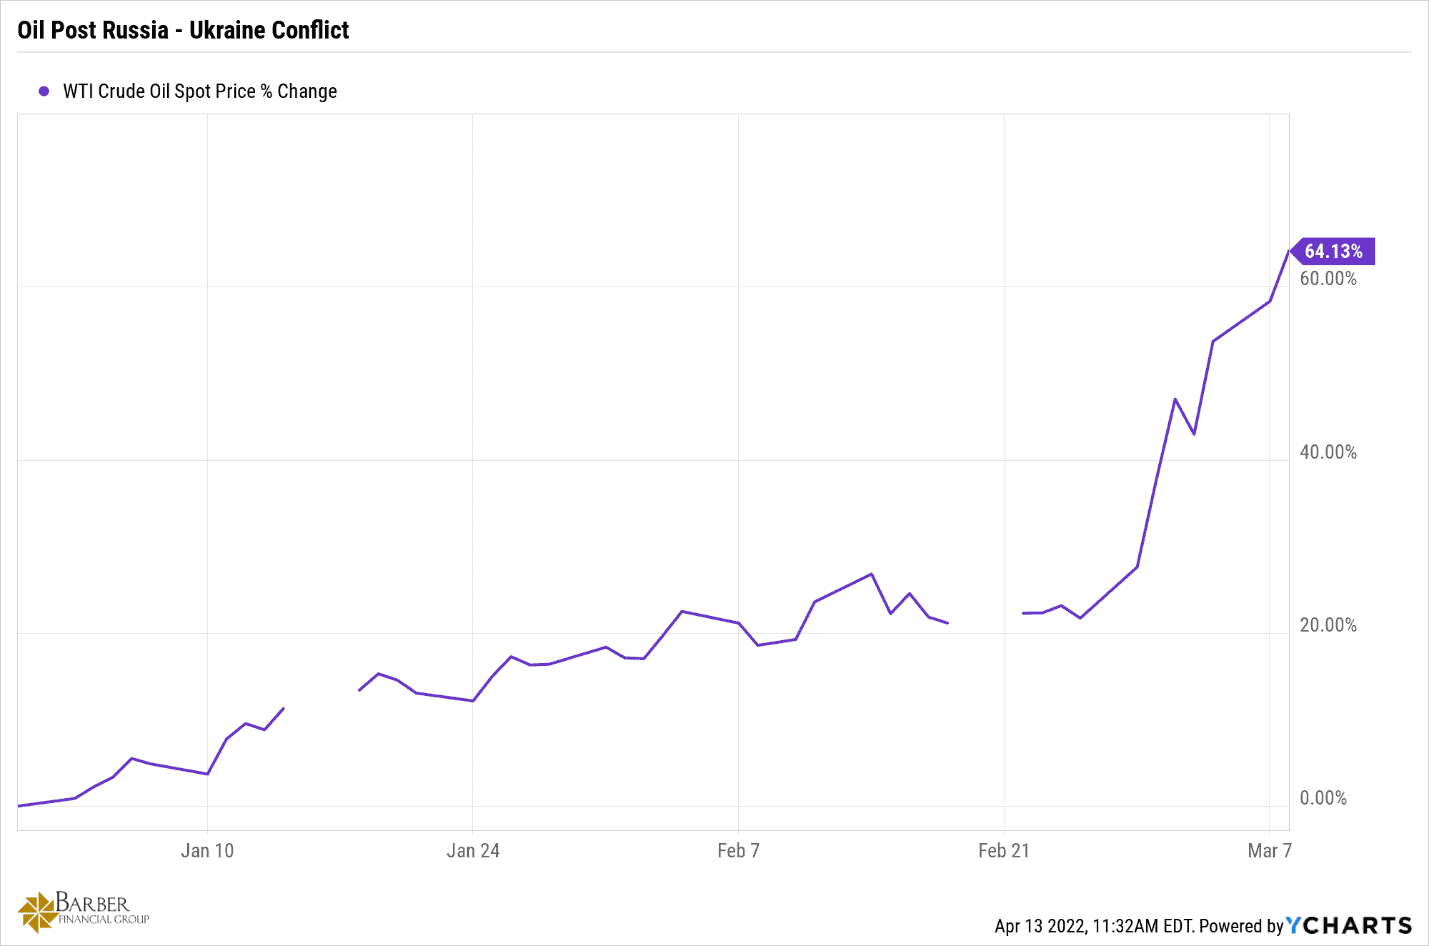
FIGURE 11 – Oil Value Post Russia/Ukraine Conflict – YCharts
WTI crude futures bounced back from earlier losses to $105.9 per barrel on April 14, extending sharp gains of the past two sessions to levels not seen in two weeks. This was following media reports about EU leaders being closer to a phased ban on Russian oil. The gradual ban would give time for European buyers to look for alternative supplies or future drilling options, while necessities in the near-term could be met by the IEA release from reserves of 240 million barrels of crude.
Still, the agency warned that from May onward, more than 3 million barrels per day of Russian oil could be shut-in due to sanctions. Other major global oil trading hubs are also planning to curtail crude and fuel purchases from Russia’s state-controlled oil companies in May. On a weekly basis, WTI crude futures were set for a 10.3% jump.
Uranium Futures on the Rise
That brings us to uranium. Uranium futures rose to $64.5 after the UK published its energy security strategy to move away from Russian oil and gas. That’s the highest level since the Fukushima disaster of 2011.
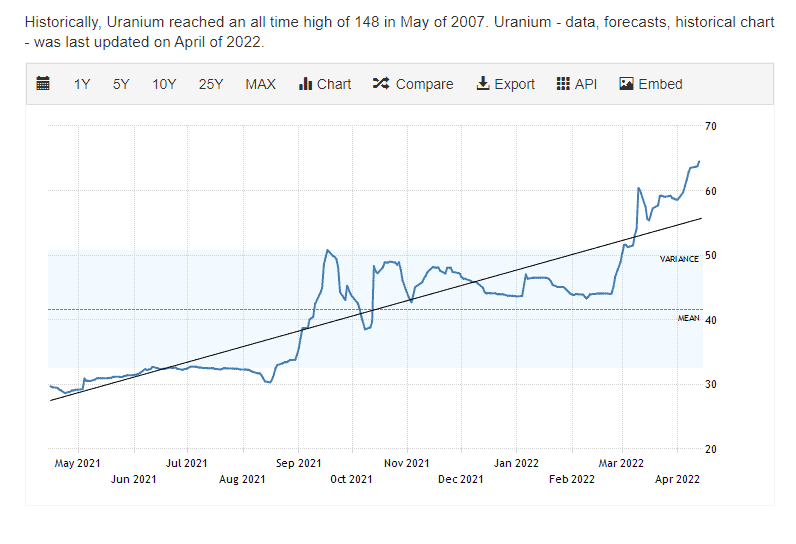
FIGURE 12 – Uranium Value – Trading Economics
In the UK’s energy security strategy, the British government plans to build eight nuclear reactors by 2030. Their goal is to triple the current nuclear energy output to supply 25% of the UK’s energy demand by 2050.
In the meantime, a bill to ban U.S. imports of nuclear fuel from Russia have already been put forward for both the House and the Senate in retaliation to reports of war crimes in Ukraine, while the European Union banned coal imports. The prospect of further restrictions on Russian nuclear fuel has increased the demand for Western uranium converters and enrichers, standing well above the current capacity for enrichment plants.
Global Demand for Natural Gas Remains High
Last, but certainly not least, let’s look at natural gas. U.S. natural gas futures jumped more than 3% to $6.9 per million British thermal units on Wednesday. That marked a fresh 13-year high, amid lower output and as global demand for U.S. Liquid Natural Gas (LNG) remains elevated, specially from European countries.
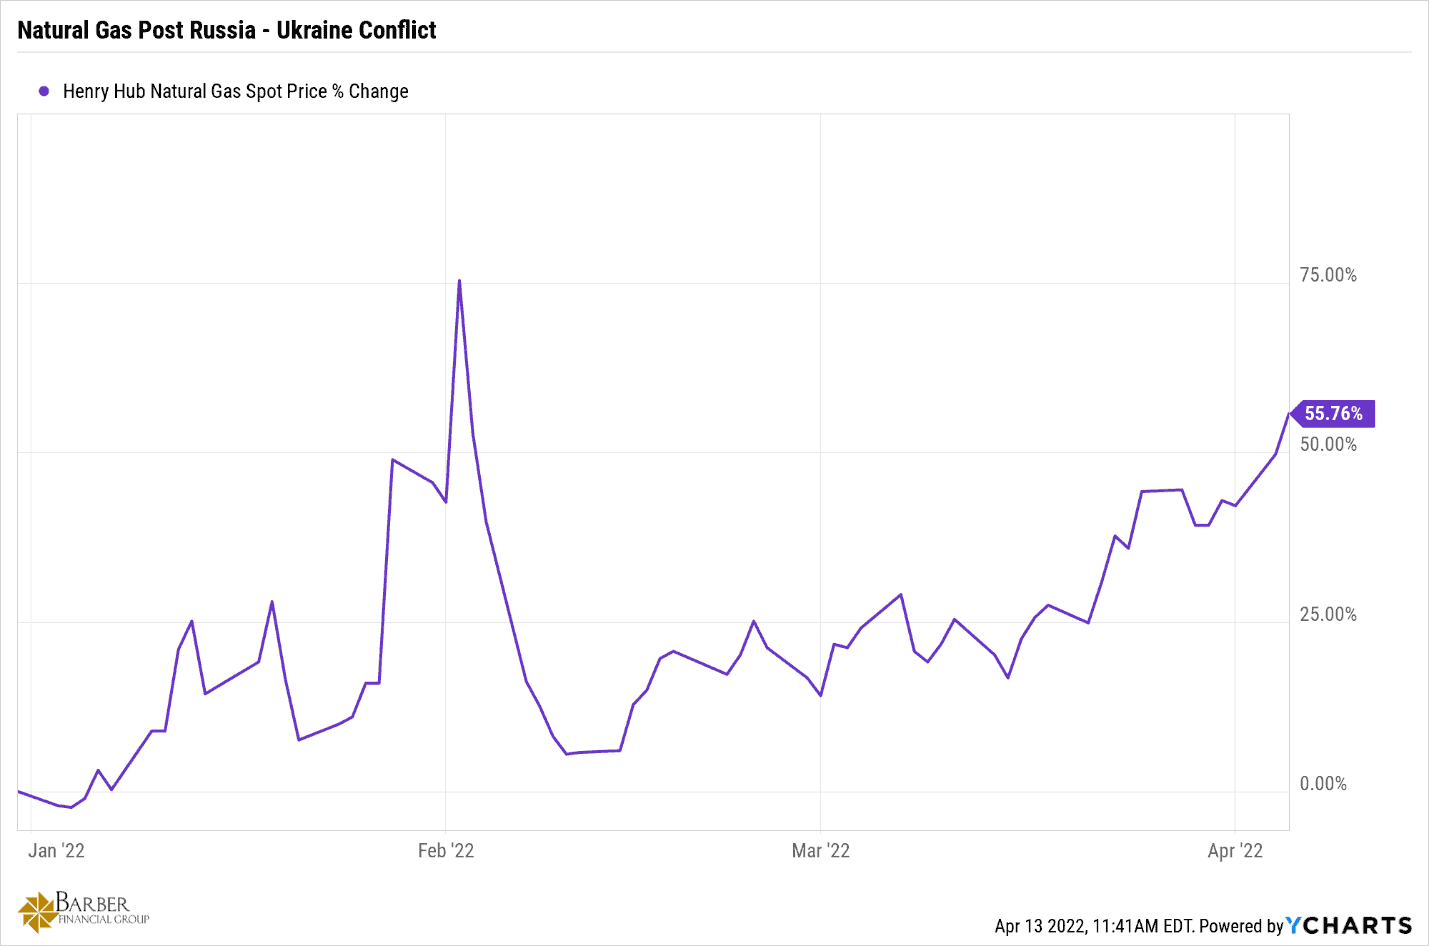
FIGURE 13 – Natural Gas Value Post Russia/Ukraine Conflict – YCharts
Preliminary data showed U.S. output was on track to drop 1.7 billion cubic feet per day (bcfd) to 93.0 bcfd on Wednesday. That was mostly due to declines in Appalachia following a 0.7 bcfd fall on April 12, Reuters reported. Also, the amount of gas flowing to U.S. LNG export plants slid from a record 12.9 bcfd in March to 12.4 bcfd so far in April. That was mostly due to declines at Freeport LNG’s facility in Texas.
At the same time, forecasts for less cold in the U.S. over the next two weeks than previously expected did little to prevent natural gas prices from rising for a third straight day.
Natural gas accounts for almost a quarter of United States energy consumption. The United States is the biggest natural gas producer, followed by Russia.
Depending on the duration of the conflict in Ukraine, the EU will need to find alternative sources for much of their natural gas. U.S. exports are one of the alternative measures that will surely be pursued, along with developing other sources of in the region.
Geopolitical Uncertainty Also Provides Opportunities
The reality is that the current geopolitical uncertainty presents plenty of problems to solve. But with problems come opportunities. While we certainly need to be thinking defensively and reducing risk where we can, we also need to be diligent in looking for the opportunities that will come out the chaos.
We learned some lessons during the COVID hell that we just lived through, and we’re seeing the same lessons emerge from these current events. The biggest lesson for most of us is that over reliance on foreign sources for critical things like energy, commodities, technology, and pharmaceuticals is short sighted, dangerous, and foolish.
The whole of the European Union has allowed themselves to be in a position of reliance on a bad faith actor to supply their most basic energy needs. To be fair, many of the countries in the EU don’t have adequate natural resources and have no choice but to import a good portion of their energy needs. But they didn’t really think through all the potential negatives that come with reliance on a guy like Putin. After all, he’s a loose cannon at best. Perhaps a realignment of sorts will take place that allows them much greater energy security. There are opportunities galore in that case.
The trend of powering everything with electricity and the need for more and more batteries is also another huge opportunity. As I mentioned earlier, most of the lithium produced in the world comes from one country. Why? The U.S. used to produce a lot of lithium but hasn’t produce any for decades. It’s time to start. There’s a lot of money to be made there, and a lot of energy security for us if we do.
Research, Research, Research
I could go on, but you get the point. We must be on the lookout for the opportunities that will arise from the geopolitical uncertainty.
If we can do that, the geopolitical uncertainty suddenly becomes less scary and less unsettling. The geopolitical uncertainty turns from a source of stress to a puzzle on a table that you can’t resist trying to get another piece to fit every time you walk by it.
The only way to do that is to ignore the breathless reporting on the news—which usually tells you nothing about the problem—and to do some research on your own. Trust me that that the amount of information that is available to you is immense. And it’s far more valuable than a 30-second sound bite on the nightly news.
Here’s to finding a lot of opportunities in 2022!
Schedule Complimentary Consultation
Select the office you would like to meet with. We can meet in-person, by virtual meeting, or by phone. Then it’s just two simple steps to schedule a time for your Complimentary Consultation.
Lenexa Office Lee’s Summit Office North Kansas City Office
Investment advisory services offered through Modern Wealth Management, Inc., an SEC Registered Investment Adviser.
The views expressed represent the opinion of Modern Wealth Management an SEC Registered Investment Advisor. Information provided is for illustrative purposes only and does not constitute investment, tax, or legal advice. Modern Wealth Management does not accept any liability for the use of the information discussed. Consult with a qualified financial, legal, or tax professional prior to taking any action.