The Great Recession’s History Remains Relevant
Key Points – The Great Recession’s History Remains Relevant
- Comparing Economic Behaviors with the Dot-Com Bubble, Great Recession, and Today
- What Caused the Housing Market to Collapse During the Great Recession?
- Analyzing Collateralized Debt Obligations and Mortgage-Back Securities
- Will the Great Recession’s History Continue to Be Relevant?
- 19 Minutes to Read
Learning for the Events that Led Up to the Great Recession
Nothing happens in a vacuum and actions have consequences. The Great Recession from 2007 to 2009 was no exception. It was also direct result of behaviors that stemmed from the bursting of the Dot-Com Bubble just seven years prior. Much has been written about the subject, and you may have even read some of it yourself.
However, it’s more likely that the event scarred you, and you’d just as soon forget that it ever happened. Having lived through it myself, I can appreciate that attitude. But like all history, we can learn from the events that led up to the Great Recession and the policy response to it. We’re going to take a deep dive into those two things to better understand where we are today, as another recession is upon us following the announcement in June of the GDP falling for a second straight quarter.
The Bursting of the Dot-Com Bubble
Beginning in early 2000, the Dot-Com Bubble burst and took the stock market on a wild ride. That ride saw the S&P 500 fall by almost 48% and the NASDAQ crater by 75% before the rollercoaster stopped. This dramatic drop in the markets, and the subsequent damage to retirement portfolios, caused many people to lose faith in the stock market and begin looking for other ways to make and invest money. It also caused the Federal Reserve to lower the Fed Funds rate from 6.5% all the way to 1%. Figures 1 and 2 below show how bad it was, and how swiftly rates came down to stop the bleeding.
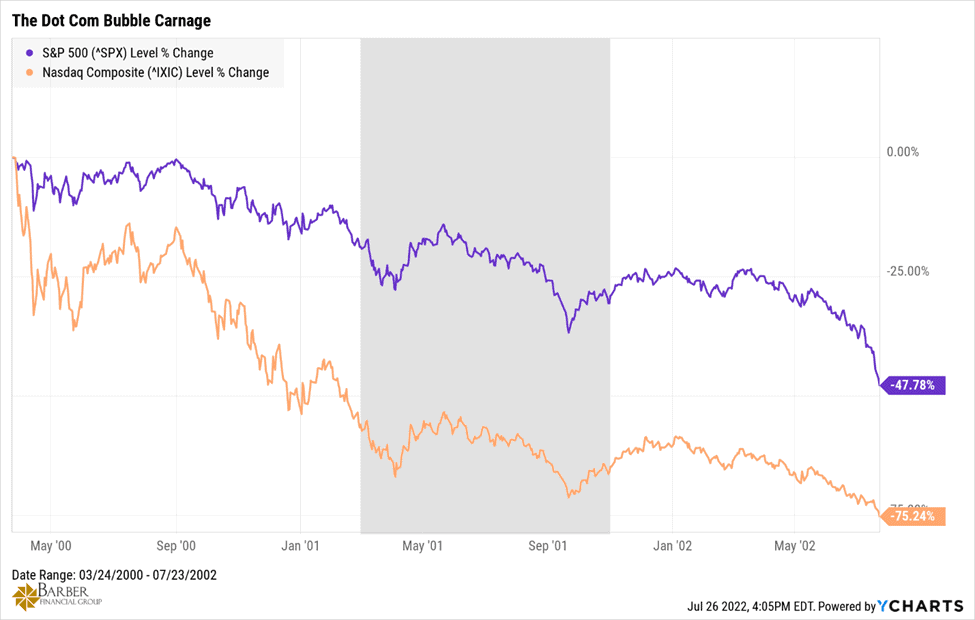
FIGURE 1 – The Dot-Com Bubble Carnage – YCharts
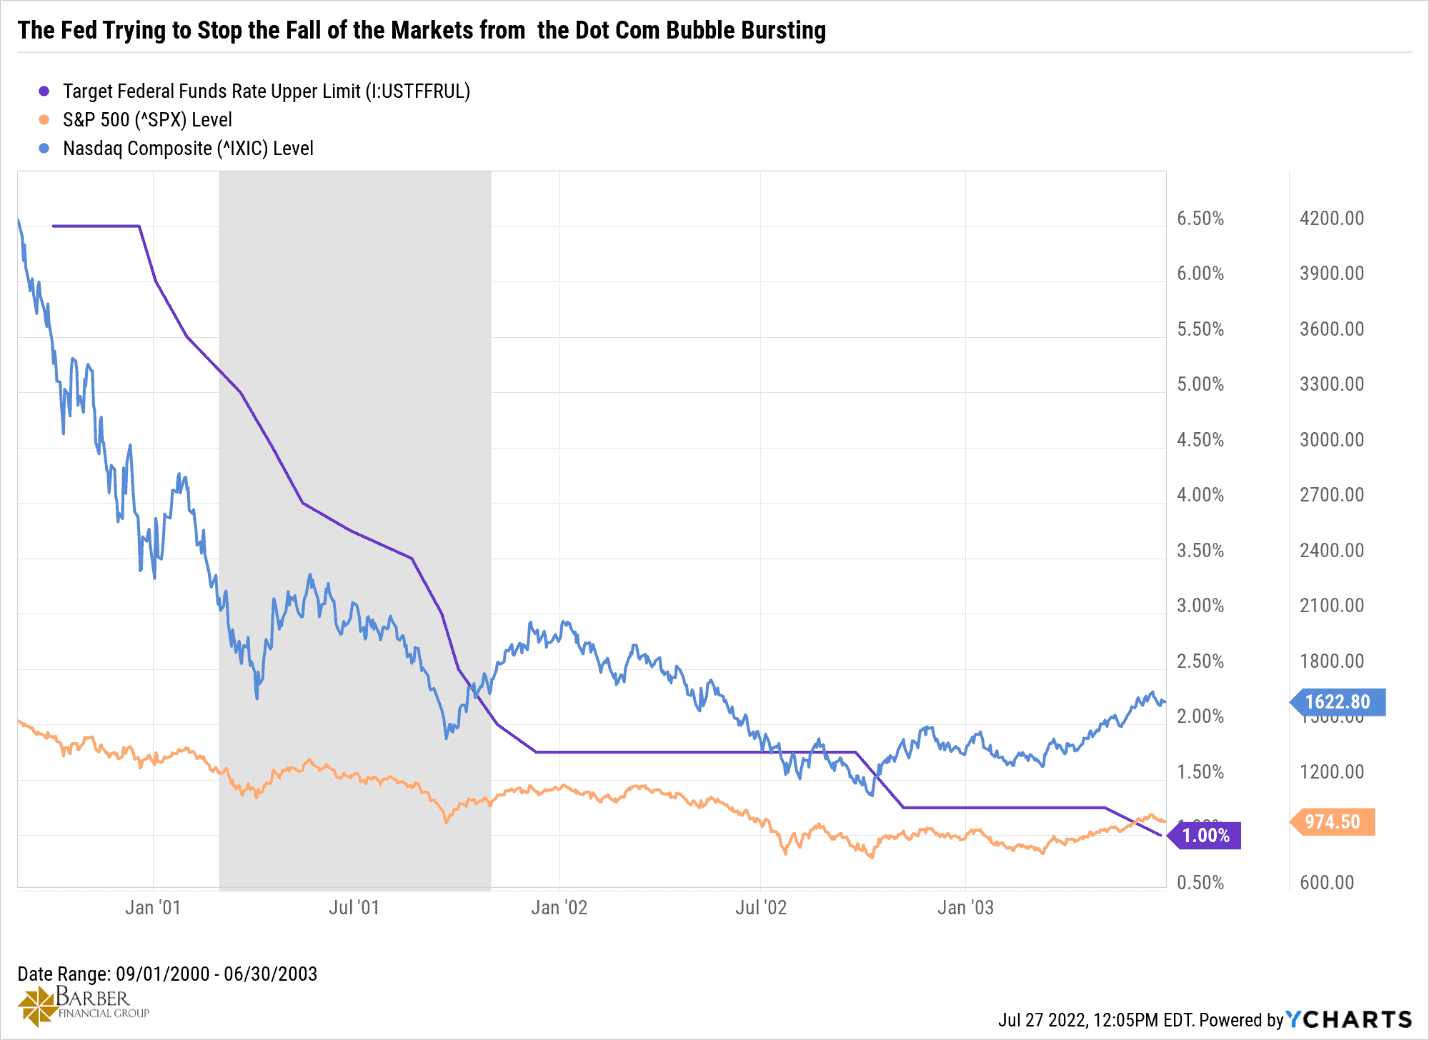
FIGURE 2 – The Fed Trying to Stop the Fall of the Markets from the Dot-Com Bubble Bursting – YCharts
Racking Up Real Estate at a Record Pace
With interest rates then at historic lows, and little faith remaining in the stock markets, people began buying real estate at a pace that had not been seen before. And it hasn’t been matched since. Much of it was purchased for personal use, but a lot was also purchased on a speculative basis. The house flipping craze became a thing.
Prior to 2000, the annual pace of existing home sales was between 4.5 and 5 million homes. But by the time the housing bubble peaked in 2005, the annual sales of existing homes eclipsed 7 million. At the same time, sales of new homes nearly doubled, jumping from 793,000 units in June 2000 to 1.389 million in June 2005. In early 2004, the Fed had begun raising interest rates again. By June 2005, they were back up to 3.5%, reaching 5.25% by June 2006. By that time, the housing bubble was beginning to burst, and sales were falling monthly.
The Crumbling of the Real Estate Market Commences in 2007
As you can see below in Figure 3, a full-on collapse in the real estate market commenced in 2007. Existing home sales fell by 53% by the time it was all said and done, ushering in the financial crisis and the Great Recession.
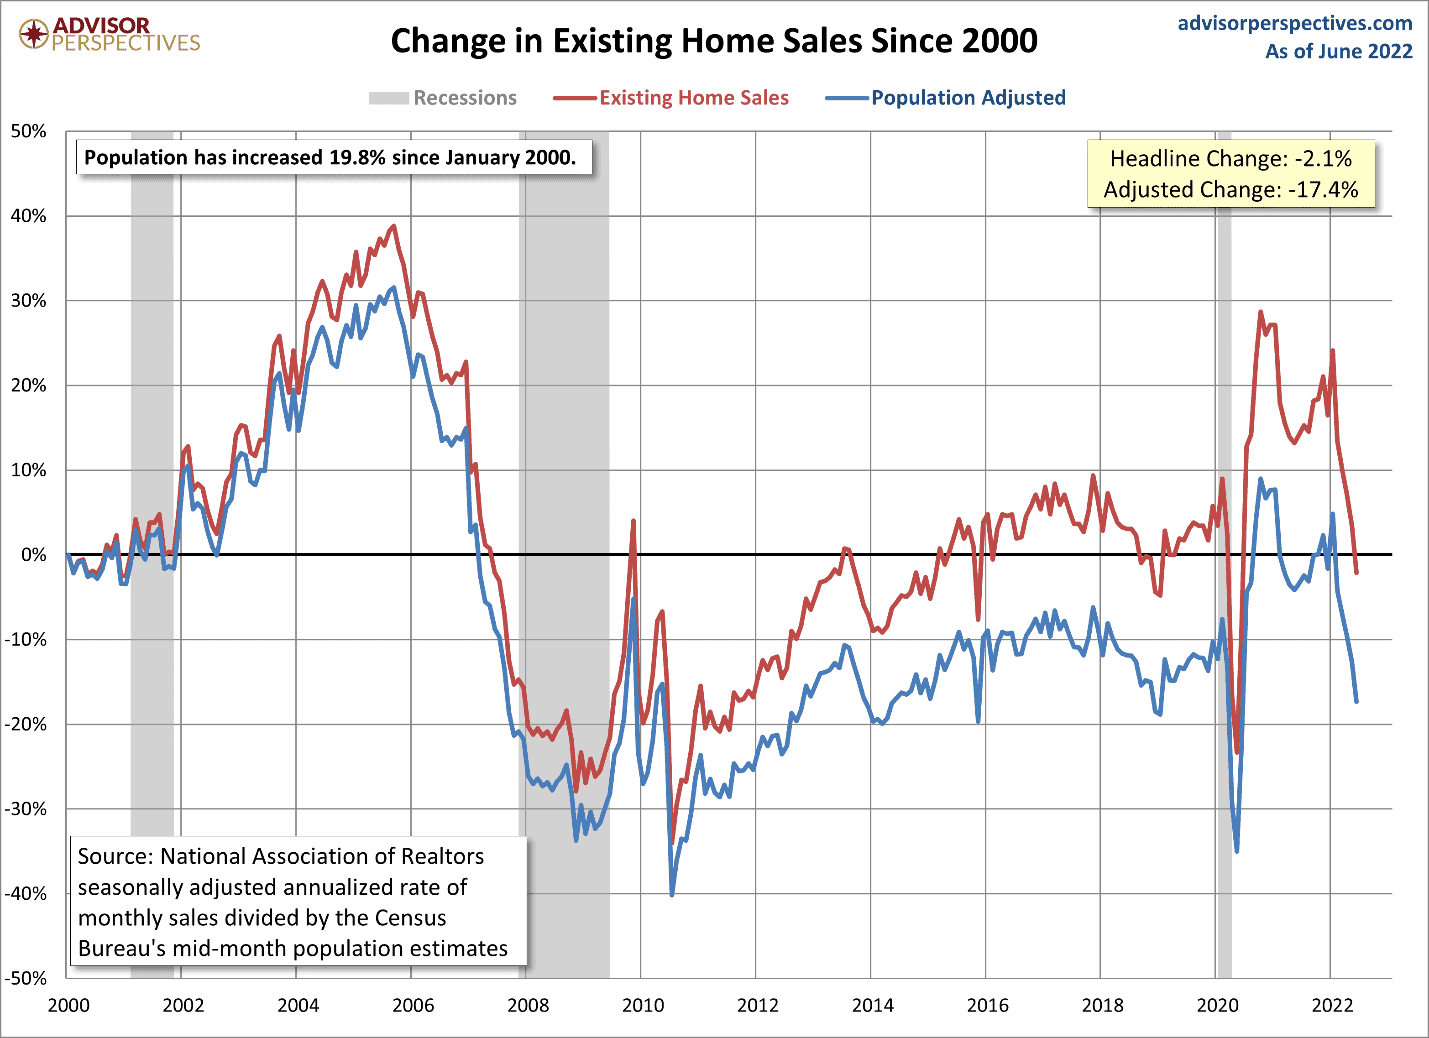
FIGURE 3 – Change in Existing Home Sales Since 2000 – Advisor Perspectives
So Many Questions About What Led to the Great Recession
But what happened? What caused the housing market to collapse, and why did it lead to the financial crisis and the Great Recession? Those are the questions we’re going to tackle next.
Home ownership is widely considered part of the American Dream, and rightly so. The only problem is that homes are expensive, and very few have the wherewithal to buy one with cash. The overwhelming majority of homes are purchased via a mortgage loan. And the credit requirements for obtaining a mortgage prior to the onset of the housing bubble were rather stringent—excluding a lot of people from the home ownership club. This led to several policies at the federal level aimed at making purchasing a home easier, and accessible to a broader group of people.
The Great Recession’s History Remains Relevant on America’s Wealth Management Show
Dean Barber and Bud Kasper take a trip down memory lane in this week’s America’s Wealth Management Show. They examine the Great Recession’s history and why it remains relevant today. There are things going on today that are eerily reminiscent of what happened during the Great Recession.
Remember Fannie Mae and Freddie Mac?
The Housing and Community Development Act of 1992 established a mandate for Fannie Mae and Freddie Mac that 30% of their loan purchases must be in support of private home ownership of “affordable” housing. The mandate would be regulated by the Department of Housing and Urban Development, and they were given the power to set future requirements. By 2003, the minimum was set at 56% of Fannie and Freddie’s loans purchased that must meet those criteria.
The National Homeownership Strategy: Partners in the American Dream was compiled in 1995 by Henry Cisneros, President Clinton’s HUD Secretary. It was a 100-page document that purported to represent the views of HUD, Fannie Mae, Freddie Mac, leaders of the housing industry, various banks, activist organizations like ACORN and La Raza, and some state and local government representatives. Graham Fisher & Company, an independent research company reviewed it and concluded that “while the underlying initiatives of the strategy were broad in content, the main theme…was the relaxation of credit standards.”
Housing in the New Millennium
On June 29, 2001, Josh Rosner of Graham Fisher and Company published an article titled, Housing in the New Millennium: A Home Without Equity Is Just a Rental with Debt. It’s a very worthwhile read if you want to take a walk down memory lane. He was incredibly prescient in this article.
Rosner wrote that the then current trend of lax lending standards would inevitably lead to a bubble that would be susceptible to any hiccup in the economy and would lead to mass foreclosures and a crash in home prices, which would in turn crash the economy and the financial system. Spoiler alert…that is exactly what happened.
At the same time, there were changes being made to the regulation of banks, along with who was allowed to engage in mortgage lending and what types of mortgages they could offer. Prior to 1982, most states had laws restricting banks from making any mortgages except conventional fixed rate amortizing mortgages. The Alternative Mortgage Transaction Parity Act of 1982 (AMTPA) changed that.
When Subprime Loans Went Primetime
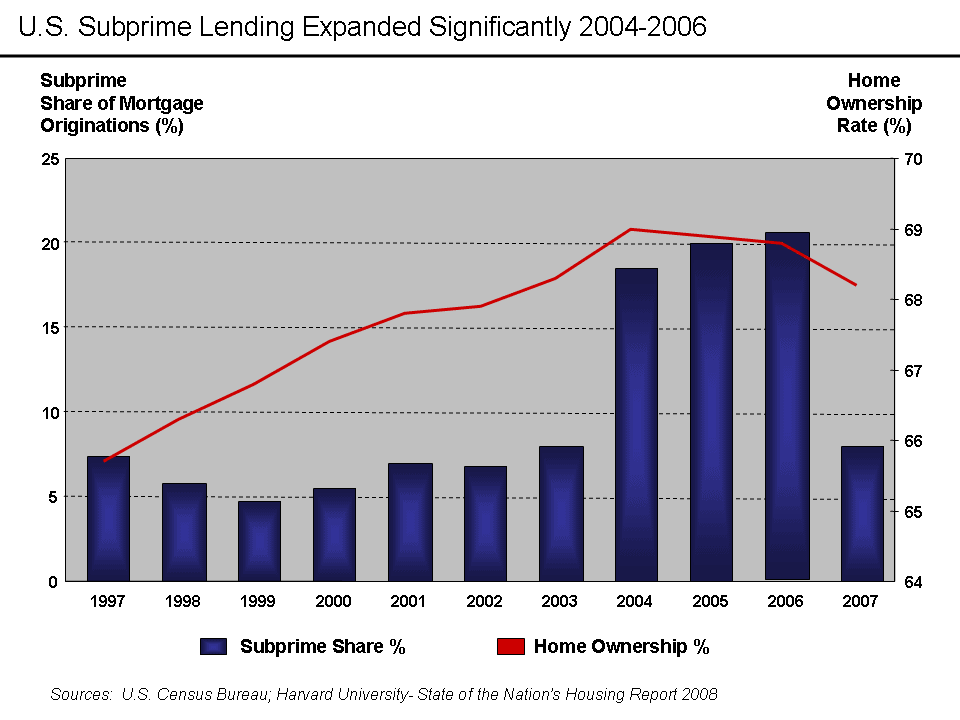
AMTPA preempted state laws and allowed banks to make adjustable-rate mortgages, balloon payment mortgages, and interest-only mortgages. Adjustable-rate mortgages were the primary instrument used in the subprime mortgage market and accounted for 90% of all the subprime loans issued in 2006. Subprime loans also made up over 20% of all the loans written that year.
The Gramm-Leach-Bliley Act was signed into law in 1999 and repealed the Glass-Steagall Act, which separated commercial banks from investment banks. Glass-Steagall had been law since 1933 and was intended to avoid potential conflicts of interest between the lending activities of commercial banks and the investment banks that rated them. At the time of its repeal, many people warned that the risk-taking culture of the investment banks would dominate the more conservative culture of the commercial banks, causing an increased level of risk taking and leverage that could lead to a bubble.
Financial Weapons of Mass Destruction
And finally, there was the Commodity Futures Modernization Act of 2000. That legislation exempted derivatives from regulation, supervision, trading on an established exchange, and capital reserve requirements for major participants. This would prove to be a costly bit of legislation eight years later. It’s a classic example of good intentions and unintended consequences. Warren Buffett referred to derivatives as “financial weapons of mass destruction.”
In October 2008, Alan Greenspan would come to the same conclusion. You might remember his famously opining that, “Those of us who have looked to the self-interest of lending institutions to protect shareholders’ equity, myself included, are in a state of shocked disbelief.”
Collateralized Debt Obligations
Derivatives are so named because their value is “derived” from the underlying assets that they hold, and they can take many forms. One such derivative is the Collateralized Debt Obligation (CDO), which is a complex financial product that is backed by a pool of loans and other assets. They are sold to institutional investors and their value is derived from the underlying assets, which also become collateral if the loan defaults.
The first CDOs were put together in 1987 by Drexel Burnham Lambert, home to the “junk bond king,” Michael Milken. Those first CDOs contained portfolios of junk bonds issued by various companies. Other firms would slowly follow suit with CDOs that contained assets that had a more predictable income stream, like vehicle loans, student loans, credit card receivables and aircraft leases. They remained a relatively niche product until the early 2000s when the housing boom was getting into full swing.
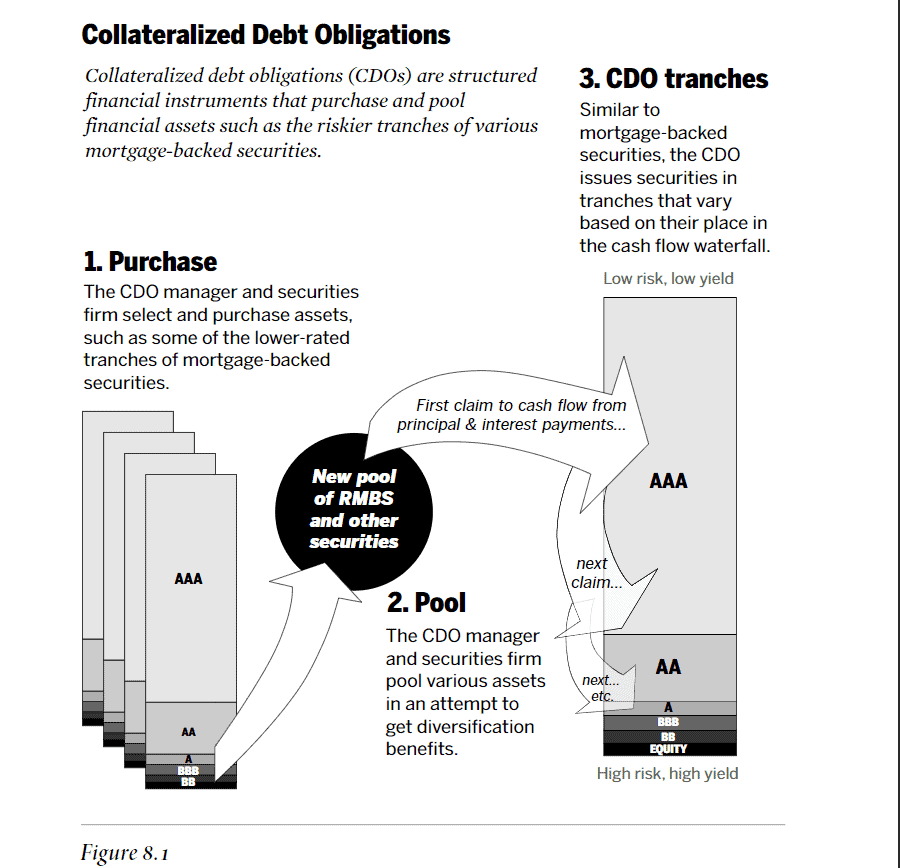
FIGURE 5 – Collateralized Debt Obligations – Financial Crisis Inquiry Report
How Wall Street Fixed the Fault of Mortgage-Backed Securities
CDO issuers began assembling their products using subprime mortgage-backed securities as the collateral for their products. Between 2003 and 2007, there were more than $700 billion worth of subprime mortgage-backed CDOs sold. Mortgage-Backed Securities (MBS) had a fault that Wall Street came up with a solution to fix. Despite their relatively high returns, any tranches in the MBS that were rated less than AAA were hard to sell. So, they simply “created the investor,” which is to say that they used the CDO to purchase the lower tranches of MBS’s and package them together. As the Financial Crisis Inquiry Report said…
“Bankers would take those low investment-grade tranches, largely rated BBB, or A, from many mortgage-backed securities and repackage them into the new securities—CDOs. Approximately 80% of these CDO tranches would be rated triple-A, despite the fact that they generally comprised the lower-rated tranches of mortgage-backed securities. CDO securities would be sold with their own waterfalls, with the risk-averse investors, again, paid first and the risk-seeking investors paid last. As they did in the case of mortgage-backed securities, the rating agencies gave their highest, triple-A ratings to the securities at the top. Still, it was not obvious that a pool of mortgage-backed securities rated BBB could be transformed into a new security that is mostly rated triple-A. But math made it so.”
Explosive Growth in Mortgage-Backed Securities CDOs
Standard and Poor’s, Moody’s, and Fitch—the big three ratings agencies—were all either blissfully ignorant to or complicit in making the risk associated with the lower rated tranches owned in these CDOs magically disappear. So, armed with AAA ratings the sky was the limit for CDO issuers. To understand the growth in the industry, consider that there were 30 billion in subprime MBS CDOs sold in 2003 and $225 billion just four years later in 2006. Some would call that explosive growth.
This securitization of loans was a huge benefit to commercial banks. Traditionally, they made loans from customer deposits and held those loans to maturity. Now, they could package and sell those loans and use the proceeds to make additional loans, which they would also package and sell. It also meant that their reserve requirements were far less since they didn’t need to hold those as protection against losses on the loans any longer. This helped improve their profitability, and the fees they received from securitization became a great source of revenue.
All this could have been fine in a vacuum, but it wasn’t occurring in a vacuum. There were other things going on at the same time that helped to inflate the housing bubble of the early 2000s. And, as I stated at the outset, actions have consequences. So, what else was going on?
Super Lax Lending Standards
For one thing, the lending standards had gotten so lax that if you could fog a mirror, you could get a mortgage. It was insanity while it was happening, but it’s even more insane looking back on it now.
For example, when I bought my first home in 1986 in Lawrence, Kansas, I was told that 2.5 to 3 times my annual income was a good rule of thumb on how much money you should devote to a home purchase. I was making about $12,000 a year then, so I found a house for $35,000. It was a nice little 1,368-square foot home that I could start raising a family in. My interest rate was 8.375% and my payment was about $300 a month.
By the time the housing bubble reached its peak, banks were lending 9.2 times annual income on home mortgages…9.2 TIMES! That would’ve meant that someone with a $12,000 annual salary could qualify for a $110,000 mortgage! At the interest rate I got back in 1986, that would mean an $821 monthly mortgage payment on a $1,000 monthly income.
I’m no mathematician, but those numbers don’t add up to me. Even at current interest rates, the mortgage payment would be $648. That’s 65% of your monthly income just for your mortgage payment. It’s stupid, but the banks were doing it.
NINJA Loans and Liar Loans
In order to sleep at night or write more and more mortgages, some lenders stopped verifying income or assets for borrowers at all. There were several variants of these idiotic loans, but my two favorites are NINJA loans and liar loans. The NINJA acronym stood for “No Income, No Job, Approved.” And the liar loans, in polite company, were called “stated income” loans. Both relied almost solely on a borrower’s credit score to make a lending decision.
They never bothered to see whether the borrowers were qualified to take out a loan for the amount they were borrowing. Why you ask? The answer is, sadly, that they didn’t care. The credit issuers just wanted to turn mortgages so they could bundle them up and sell them at a profit. A pesky little thing like due diligence could not be allowed to slow the mortgage machine down.
But it gets better.
Home prices were increasing at such a rapid pace that lenders began making 100% loans that required no financial skin in the game from the borrower. As you probably remember, a lot of the homes being built and sold then were the “McMansion” variety, as baby boomers were looking to get into bigger homes where they had room to get away from their kids…or to make room for them when they boomeranged back home for one reason or another. But I digress.
Some People Needed to Be Lent Some Financial Intelligence
The homes were so big, and appreciating so fast, that lenders decided it would be a good idea to start lending up to 125% of the home’s value! People who couldn’t afford the house borrowed more than the house was worth and used the 25% of the home’s value they got in cash at closing to fill the house that was too big that they couldn’t afford with stuff they didn’t need with money they just borrowed that they would be paying for over the next 30 years.
Have you ever heard of something less financially sound? Those people were 25% underwater in their homes the day they set foot in them, and they were happy?!?! Many historians of the Great Recession talk about the predatory lending of some of the financial institutions at the time. But very few of them have the intestinal fortitude to call out the absolute idiotic behavior of far too many supposedly sentient adults who absolutely knew they were NEVER going to be able to service the loans they just took out but did it ANYWAY.
Housing: A Leading Economic Indicator
Because there is so much economic activity that is generated by the housing industry, housing is a leading indicator as to where the economy is headed. For the years following the Dot-Com Bubble, housing was going straight up…until it wasn’t. As I indicated earlier, by the time 2006 rolled around, the Fed had raised the Fed Funds rate to 5.25% to slow the rate of growth of the economy. It had the intended effect, but there was a problem they didn’t see coming.
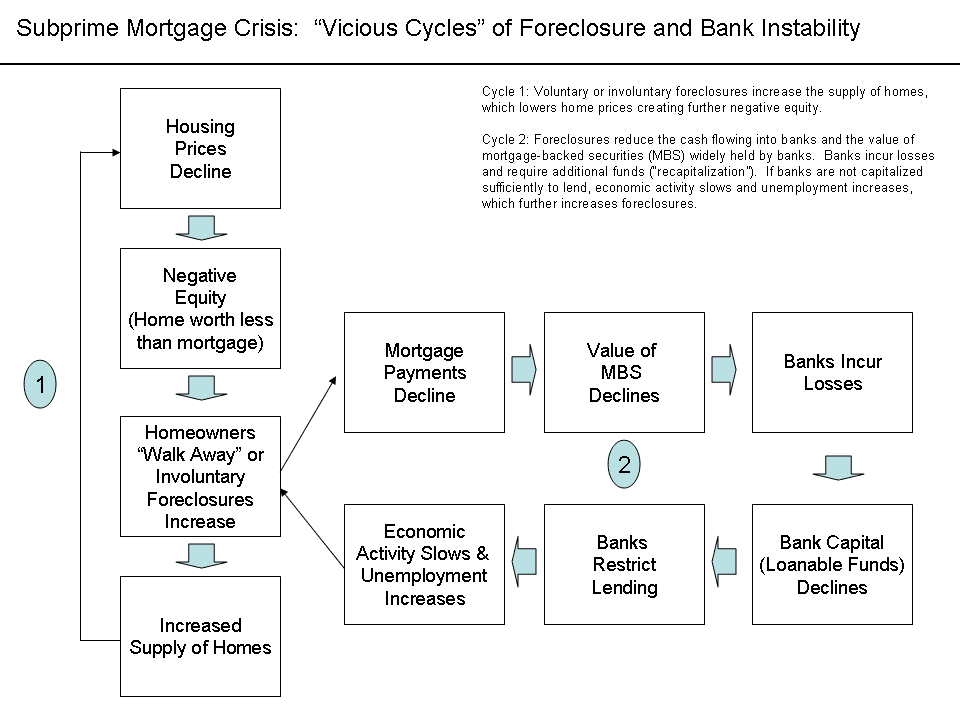
A Very Vicious Economic Cycle Caused by Falling Home Prices
As home buying slowed, prices began to fall. That meant values were falling and the lenders who had made those 125% loans expecting the values to increase in perpetuity—and more directly the CDOs that held those loans—were in trouble. In the economy there are virtuous and vicious cycles.
The falling home prices, and all the shenanigans and sleight of hand in the lending that had inflated the bubble, began a vicious cycle that took several years to run its course. Here’s how it played out.
The ratings agencies had to eat a huge dish of humble pie, as it became obvious that the Mortgage-Backed Securities and CDOs that they had rated AAA were anything but. By the second quarter of 2008, they had downgraded the ratings on nearly $2 trillion in MBS. Many were downgraded to BBB or less. That had a huge impact on the financial markets and caused credit to basically evaporate. Banks weren’t even lending to one another. We were no more than a few days away from people not being able to cash their paychecks. And that’s not hyperbole.
This vicious cycle took down some very large financial institutions, not the least of which was Lehman Brothers, who filed for bankruptcy on September 15, 2008. It very nearly took out the investment arm of AIG as well, though they were deemed “too big to fail” and were bailed out by the government.
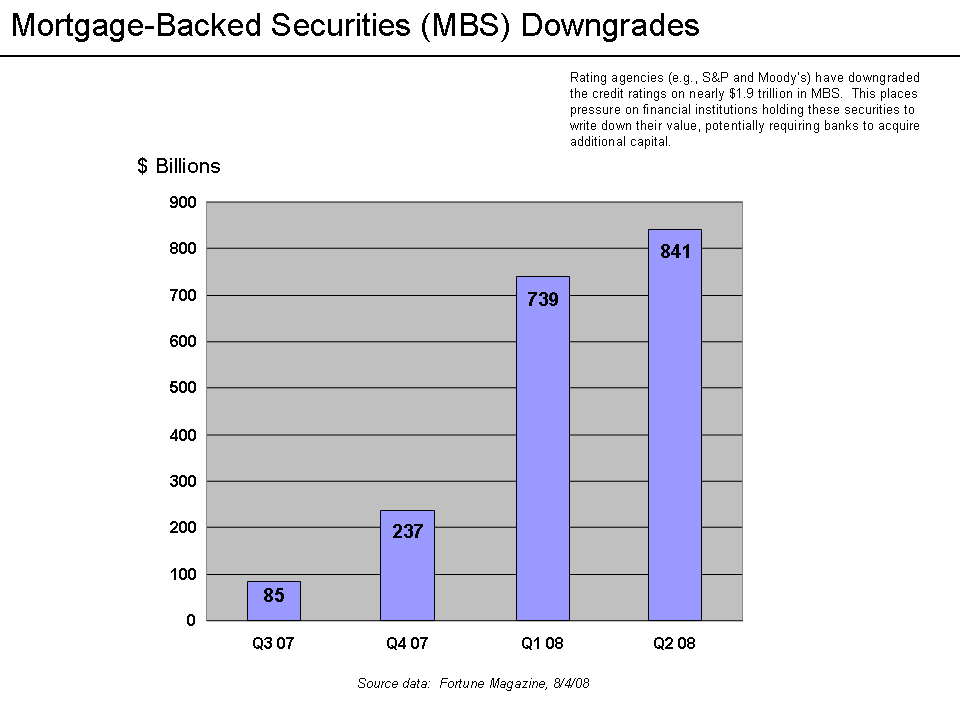
FIGURE 7 – Mortgage-Backed Securities (MBS) Downgrades – Fortune Magazine
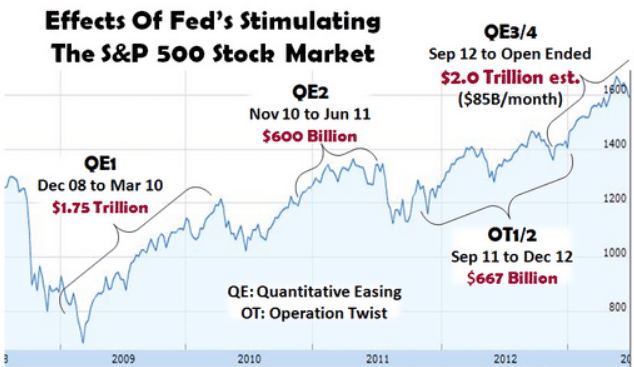
FIGURE 8 – Effects of Fed’s Stimulating the S&P 500 Stock Market – Jobenomics
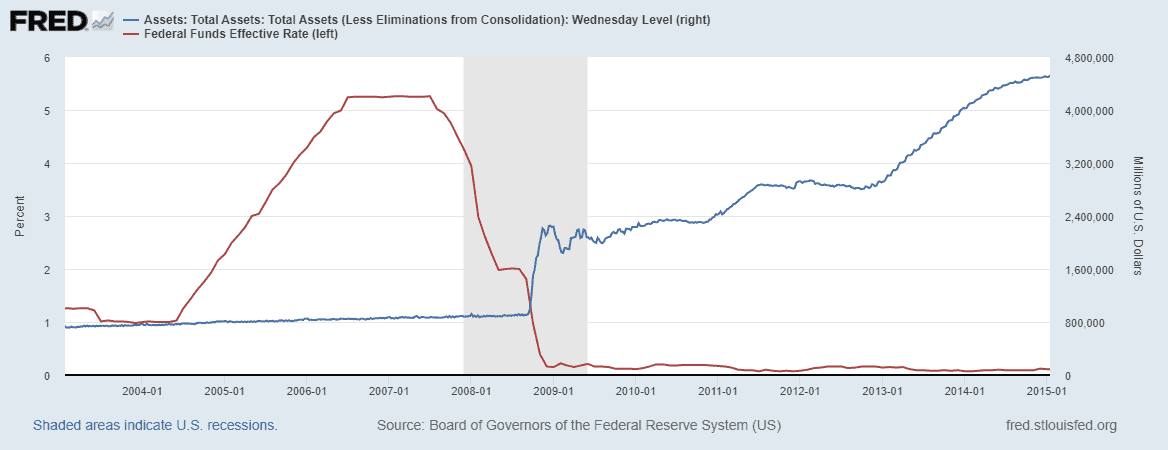
Lengthy Quantitative Easing Plans from the Fed
So, the Fed stepped in, dropped the Fed Funds rate to zero, and started buying up all these toxic assets that the market had created. They injected desperately needed liquidity back into the market through an aggressive series of quantitative easing plans that would last for years. Note that in Figure 8, above, that every time they stopped a QE program the stock market would drop dramatically until the next QE began.
By the time it was over, the Fed’s balance sheet had increased to $4.516 trillion.
A Flurry of Foreclosures
However, it wasn’t enough to save the homeowners who were in over their heads in a home that was losing value. Between 2006 and 2014, nearly 10 million people had their homes foreclosed on. Suddenly, banks cared about the loan-to-value ratios again.
A friend of mine had purchased a large home during the housing bubble on an adjustable-rate mortgage with very little money down. The home was valued at around $1 million at the time. By the time the bubble had burst, the home was only worth about $600,000. He was upside down in the home by nearly $400,000. The bank told him he had two choices. Either write them a check to bring the loan-to-value ratio back to 80% or they were going to foreclose on him. And foreclose on him they did.
That scenario played itself out time and again all over the country. There was a short time where most of the big banks stopped foreclosures, which you can see below in Figure 10 where they dropped from over 550,000 to just 19,000 almost overnight. That would be a temporary respite though. Those that couldn’t get their financial house in order by the time they started foreclosures again were eventually forced out of their homes.
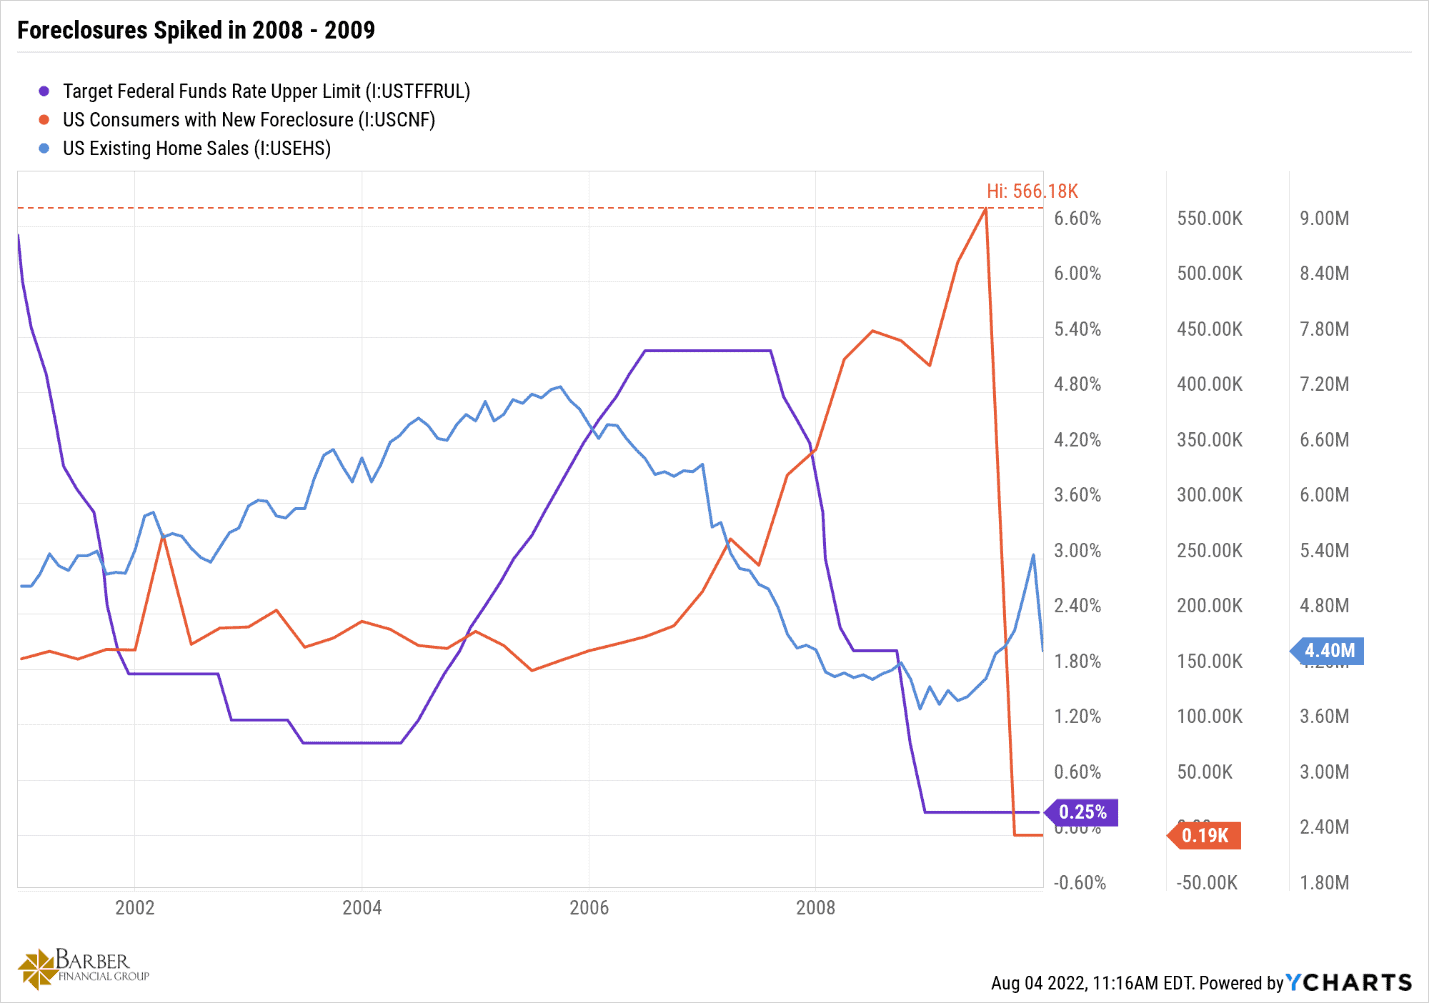
FIGURE 10 – Foreclosures Spiked in 2008-2009 – YCharts
That brings us to Figure 11, which clearly shows that the Great Recession was a bad time to be a realtor, home builder, or someone wanting or needing to sell their home.
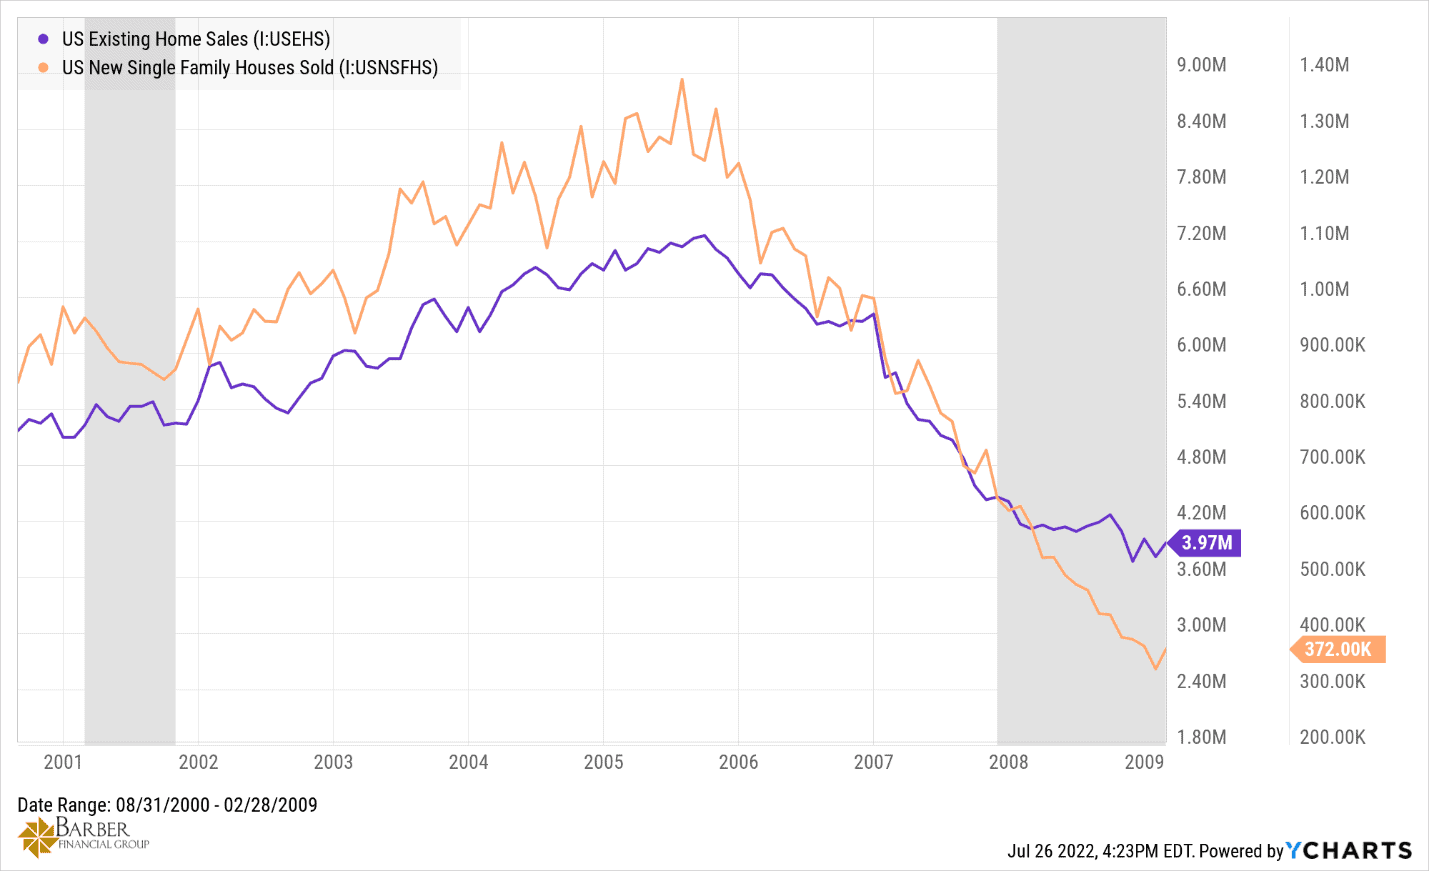
FIGURE 11 – U.S. Existing Homes Sales vs. U.S. New Single Family Houses Sold 2001-2009 – YCharts
Dried Up Demand for Housing
Existing home sales fell 53%, dropping from 7.3 million units to 3.45 million units by 2010. New home sales fell from 1.1 million units to just 270,000 units by early 2011. That’s a staggering 75% decline. Many builders had been throwing up houses as fast as they could on speculation, anticipating an ever-increasing demand. There were entire neighborhoods built for sale that sat vacant for a long time when the demand dried up.
Many were turned into rentals to help service the loans and keep the builder from going under. Unfortunately, a lot of builders did go under. In 2007, there were 98,067 new home builders. By 2012, there were only 48,557 remaining. That’s a 50% drop. And a lot of real estate agents left the business too. The National Association of Realtors saw their ranks shrink by 140,000 members. And, sadly, a lot of people took a bath on a property that they were forced to sell due to a relocation or some other occurrence that compelled them to move.
Commodity Prices Surge
In the meantime, commodities were going up dramatically, causing the looming crisis to be even more economically devastating. Oil surged to $145 a barrel in June 2006. And fell all the way back to $35 by January 2009 during the recession.
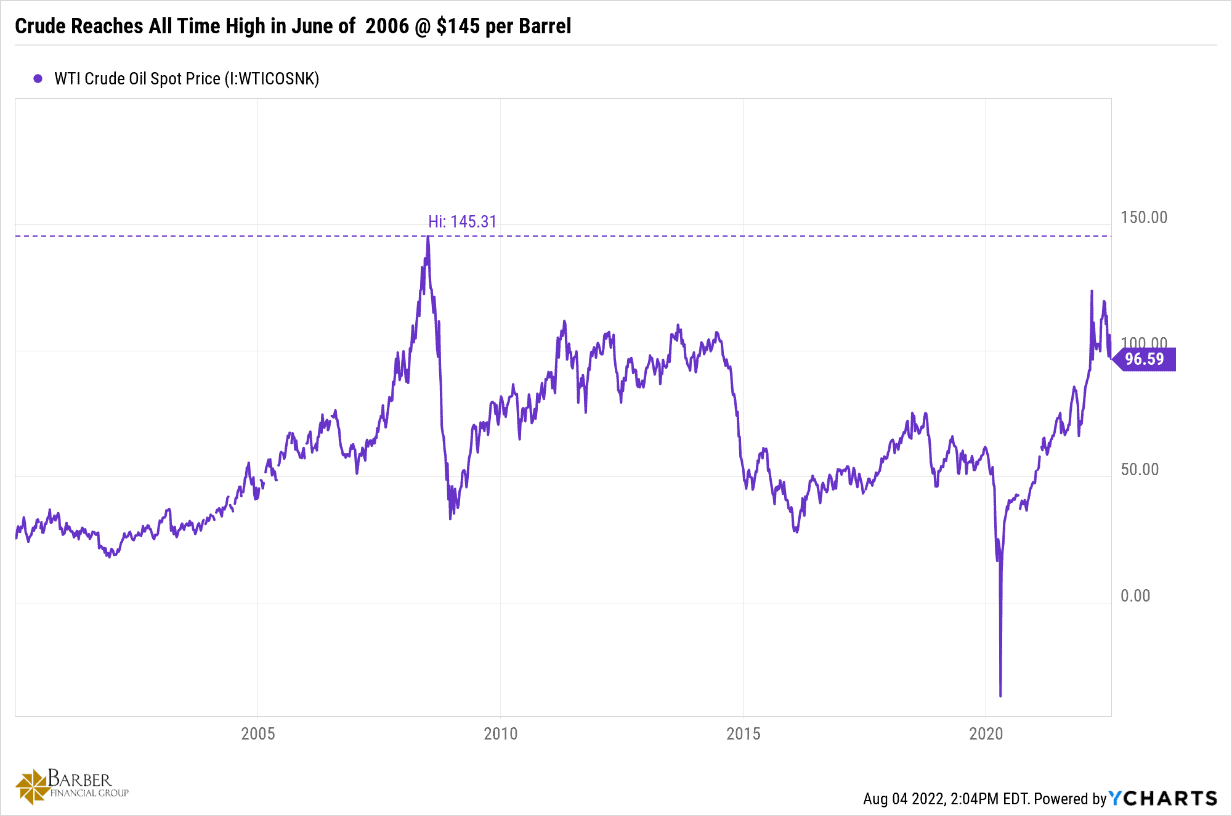
FIGURE 12 – Crude Reaches All-Time High in June 2006 at $145 per Barrel – YCharts
Wheat prices doubled between March and September of 2007, eventually climbed all the way to $1,073 per bushel, and soybean prices more than TRIPLED!
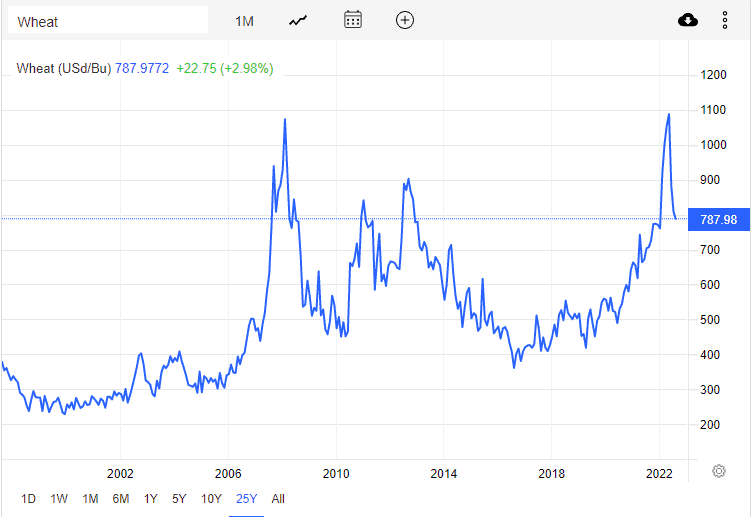
FIGURE 13 – Wheat – Trading Economics
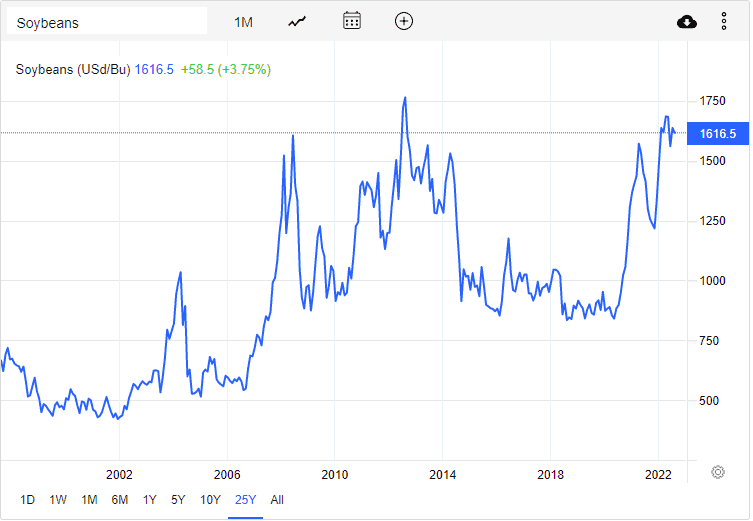
FIGURE 14 – Soybeans – Trading Economics
The Great Recession’s History Appears to Be Repeating Itself
In Figures 12-14, something should have stood out to you. Did you see it? In case you didn’t catch it, all three of those commodities have exploded in price over the last 12 to 18 months. And it should be of concern to all of us. Because what’s going on today is very similar to what was going on in the 2006-2008 timeframe.
The stock market made an all-time high on January 4, 2022. But it has fallen since. Oil, wheat, and soybeans, along with most other commodities are near all-time highs. The housing market has been roaring due to several factors since 2020. The median price of a home in the U.S. set an all-time high in June. And, because inflation is high, the Fed is raising interest rates. That’s causing the average 30-year mortgage interest rate to jump up to around 6%.
The Great COVID Migration
There’s little doubt that we are in a new housing bubble that is showing signs of weakness. What I believe drove this new bubble was what I refer to as the Great COVID Migration. The onset of COVID and the subsequent desire to have more space was the main driver creating this new bubble.
Boomers bought second homes or moved to more rural areas while the millennials began moving en masse from the more urban areas to the suburbs. Suddenly, where there was once an abundance of homes to choose from, supply got tight and bidding wars on available listings became the norm. Most homes that got sold were selling above the listing price…and sometimes by a lot.
Realtors and home builders daily lamented the lack of available inventory, which drove prices higher and higher. The median price for a single-family home hit $425,000 in June. It has begun to fall slightly in the last couple of months. These crazy prices, along with the rising interest rate environment that we are in, is problematic for the housing market going forward. We are shrinking the pool of potential buyers. My article, When a Housing Shortage Becomes a Surplus, details exactly what I expect to happen in the coming months.
The Cure to High Prices Is High Prices
As you’ve no doubt heard me or someone else say, high prices are the cure for high prices. That means that when the cost of something exceeds the perceived value assigned to it by the end user, they vote with their feet and find a way to use less of that product or find a cheaper alternative.
Eventually, the demand for the overpriced product wanes and the price comes down to attract buyers back in. Housing is no different. When the bidding wars stop—and they are—the prices are going to come down. That gives potential buyers hope.
But since they see the price coming down, they figure they’ll wait a little while longer to see if the price will drop again. Lather, rinse, and repeat. Before you know it, prices are down substantially, and the buyers come back in. We’re currently in the phase where the buyers leave. Look at existing home sales over the last three years as the high prices and higher interest rates take effect.
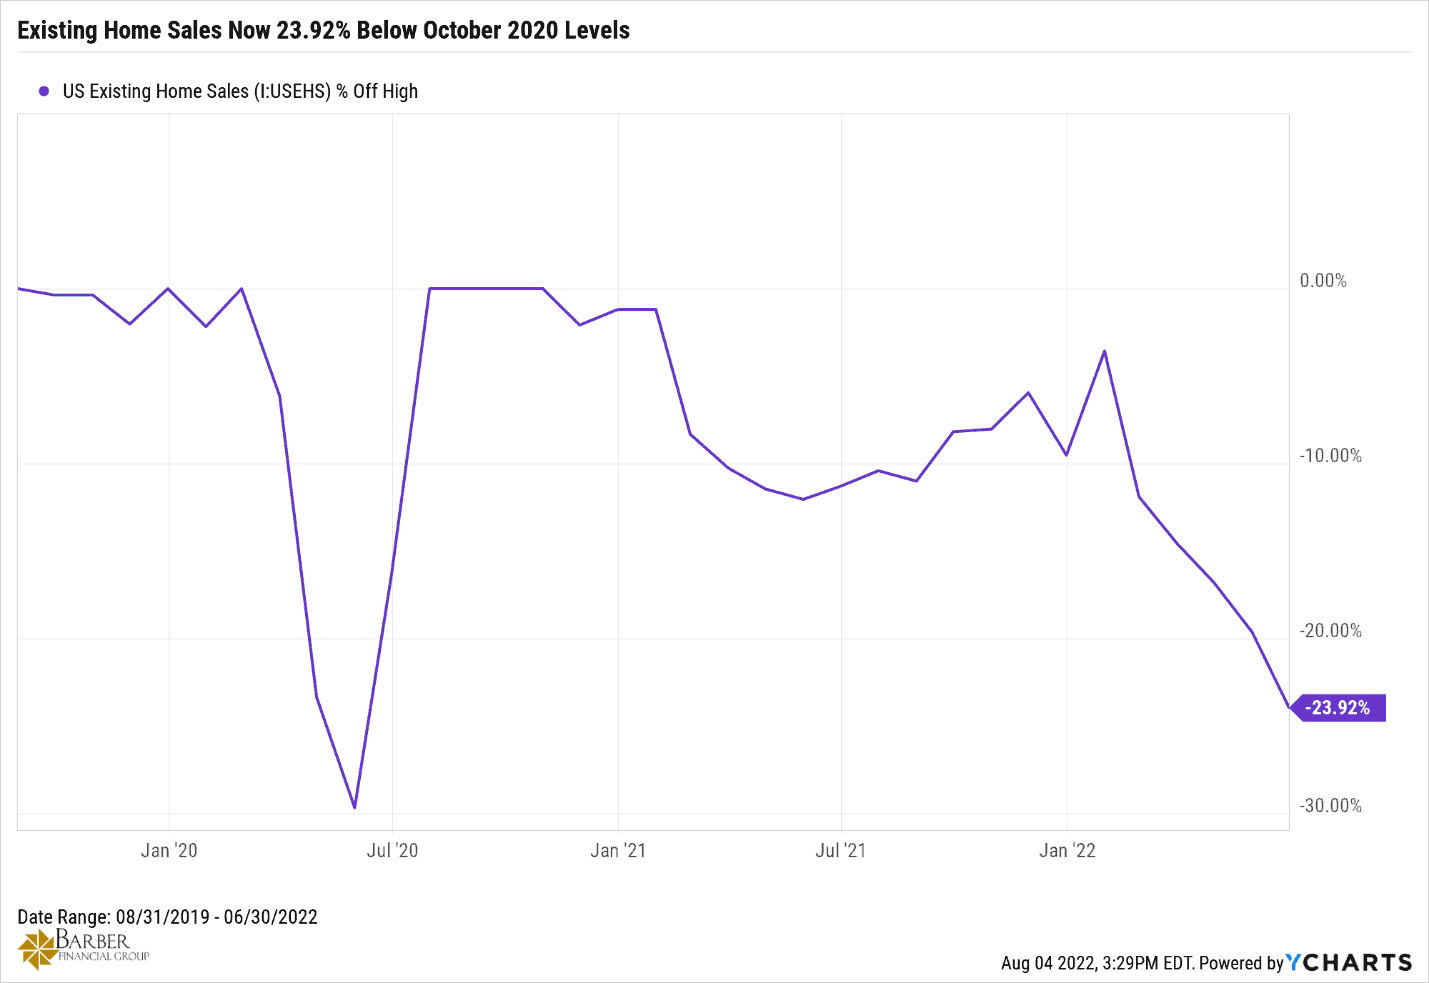
FIGURE 15 – Existing Home Sales Now 23.92% Below October 2020 Levels – YCharts
The Ludicrous Lending Is Happening Again
Remember the idiotic loans they were doing during the last housing bubble? You probably thought that the banks other lending institutions wouldn’t do that again, didn’t you? I did too. But they are.
Currently, there are 100% LTV mortgages being issued, again, because they once again think home values are going to go up in perpetuity. I guess some people just can’t remember what they had for breakfast, let alone what happened 15 years ago.
So, when home values go backward, the result will be the same as last time. The only saving grace is that those loans are not as prominent today as they were back then. But there is one especially egregious mortgage being offered, or at least it was that you should know about. Some outfit called BurkeyLoan announced in 2017 that it was going to offer 120% LTV mortgages for millennials with student loan debt to help them get into a house and pay off their debt…over 30 years.
Why Are the Buyers Disappearing?
As we discussed earlier, banks were lending 9.2 times your annual income to buy a house back in the peak of the last housing bubble. Remember how insane you thought that was? Well, things have gotten even further out of whack in this latest bubble.
Figure 16, below, shows why the buyers are disappearing. It’s because even IF a bank would loan the average earning family 9.2 times their income today, they still couldn’t afford the median home in their city in a lot of cases. Check out the home to income ratios in some of these cities. Figure 16 explains Figures 17-19 that follow.
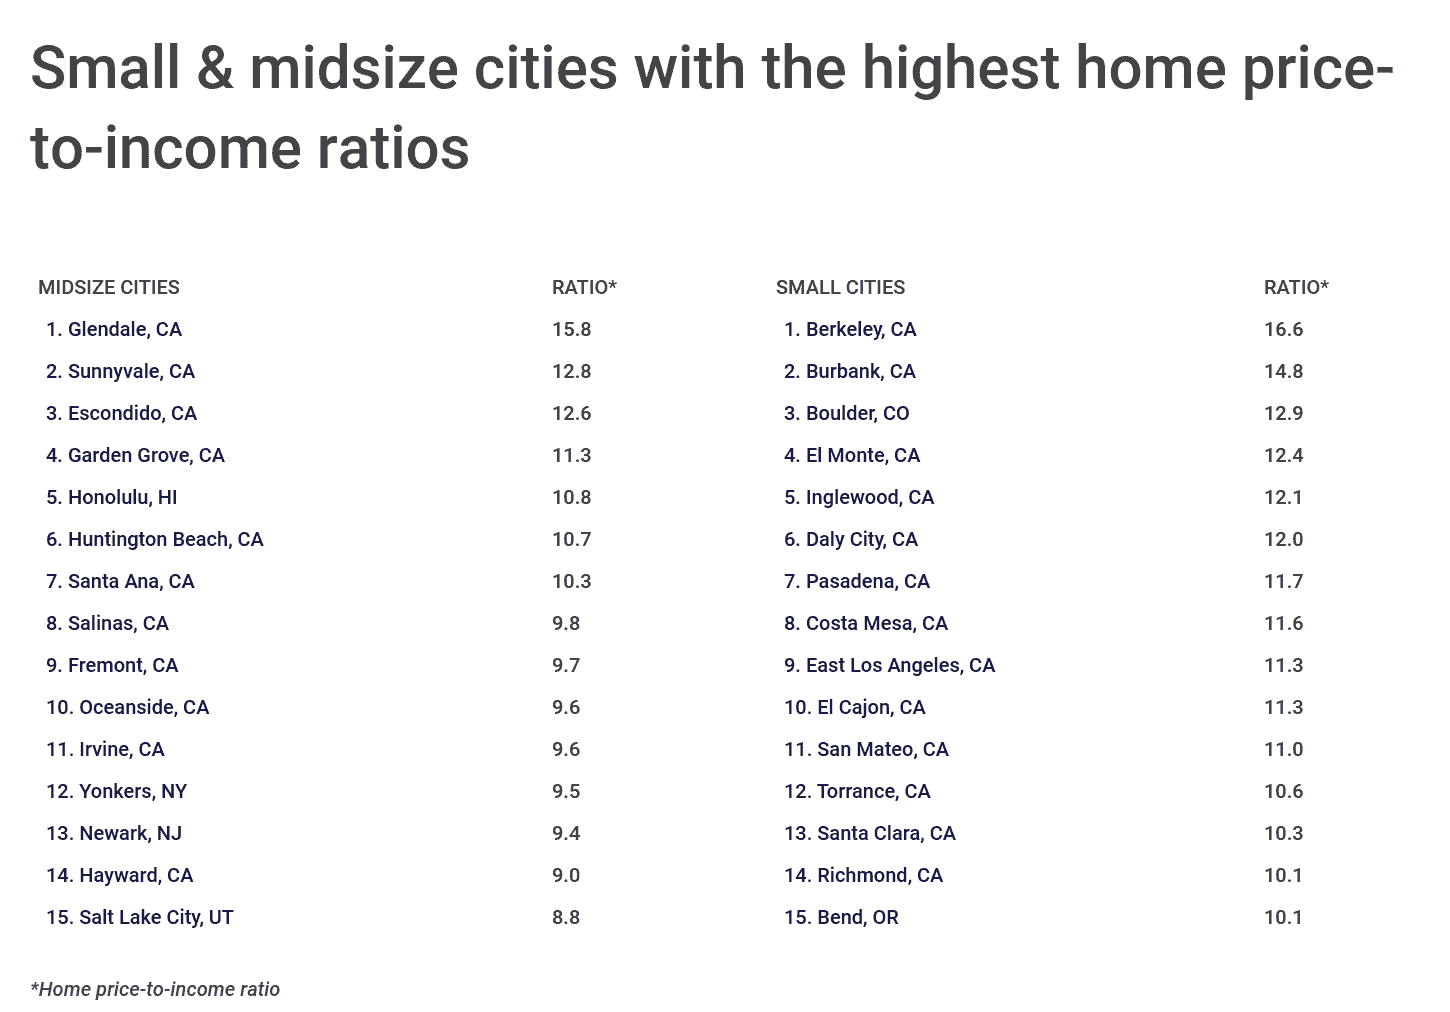
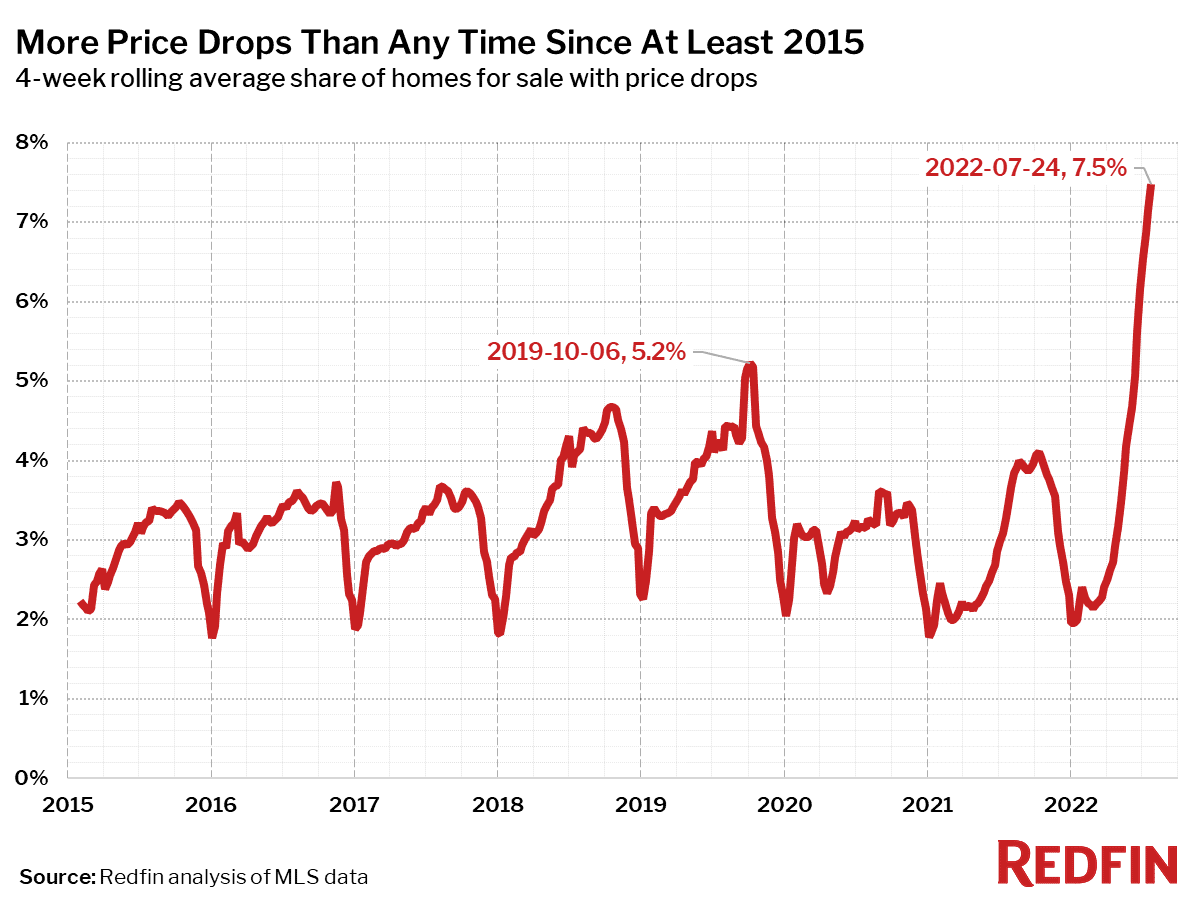
FIGURE 17 – More Price Drops Than Any Time Since at Least 2015 – Redfin
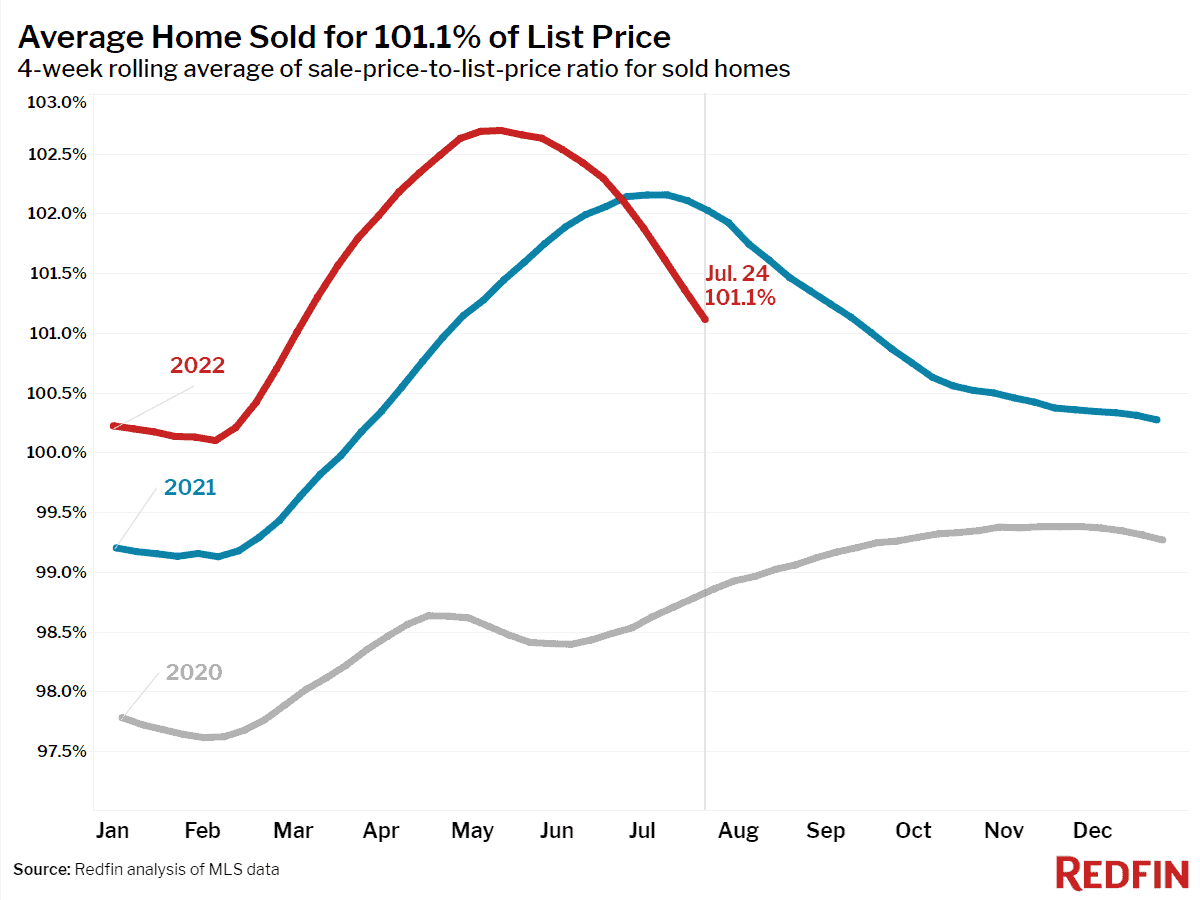
FIGURE 18 – Average Home Sold for 101.1% of List Price – Redfin
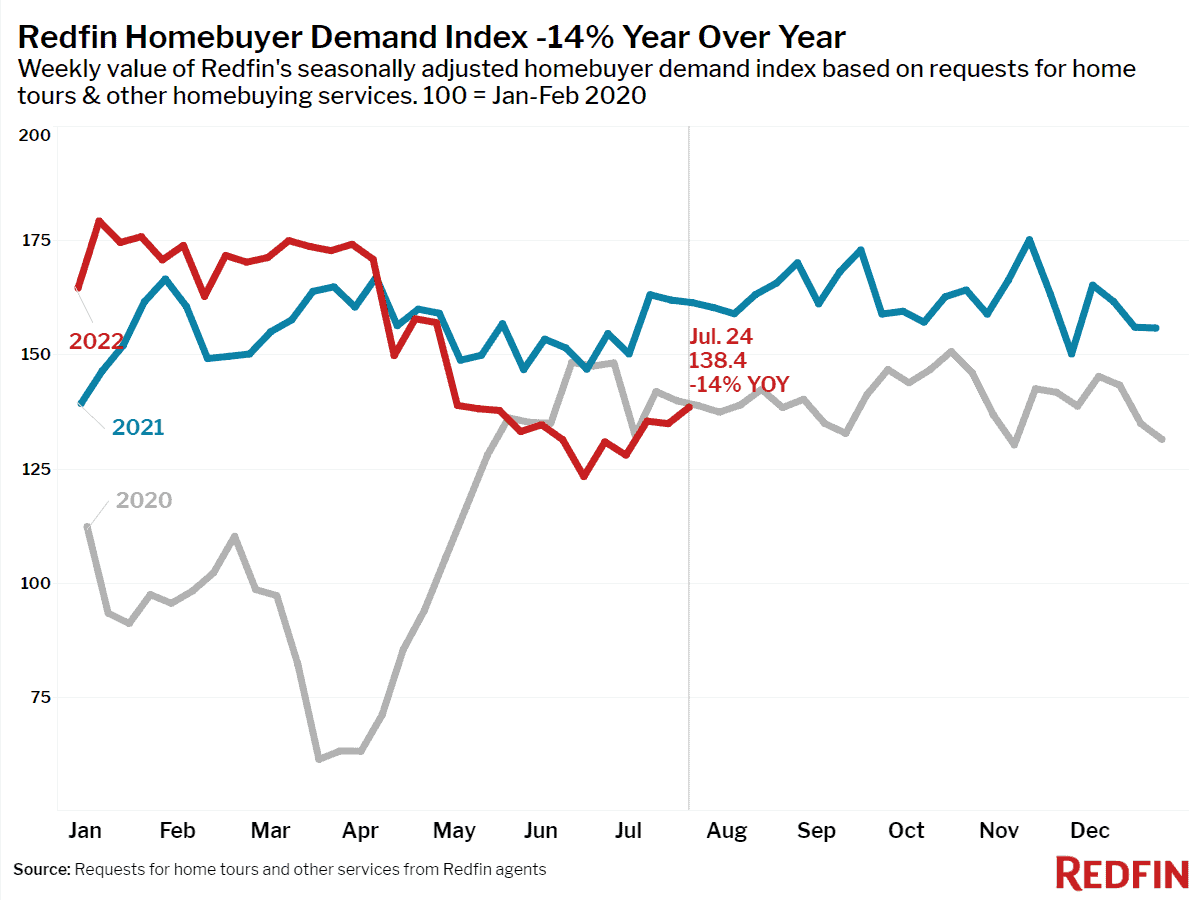
FIGURE 19 – Redfin Homebuyer Demand Index -14% Year Over Year – Redfin
It’s not just existing home sellers that are dropping their prices. Home builders are dropping prices and offering other incentives to move houses, as new home sales are 30% below last year. Buyers are also cancelling contracts at a much higher rate than last year. Cancellation rates in June were 14.5% nationally.
Home builder confidence posted its seventh consecutive monthly decline in July, falling 12 points to 55. That is the second biggest single month drop in history. The only drop bigger was at the onset of COVID in 2020. We are in historic territory here, folks.
“This Is a Meltdown”
The supply chain issues are causing builders production bottlenecks and inflation is causing the cost of land, construction, and financing to exceed a home’s market value. Pantheon Macro Chief Economist Ian Shepherdson told Forbes in emailed comments that builder confidence has “farther to fall,” and that he believes “this is a meltdown.” He added, “Pretty soon, anyone who has bought a home in recent months will be sitting on a loss.”
Mortgage lenders are cutting thousands of jobs in their home lending departments. They include Wells Fargo, LoanDepot, and JP Morgan. LoanDepot has already cut 2,800 jobs so far this year and plans to cut another 2,000 by years end, which represents about 40% of its employee total from 2021. And real estate firms Compass and Redfin have both cut their employee count by roughly 450 people.
We’re Technically in a Recession
All this comes as we got confirmation that GDP declined once again in the second quarter. That technically means we’re in a recession, whether people want to admit it or not. Had we been listening on a national level, our leading indicator, housing, was telling us where we were headed. Lumber prices were confirming the message. Lumber is now down 70% from its all-time high in March 2021 and 66% from its most recent high in March 2022 and moving lower.
Crude oil has now rolled over and is now trading below $90 a barrel. Wheat has come down by almost 50% from its May peak. Corn has rolled over and is almost 30% below its May high as well. This is all good news and bad news at the same time.
It’s good news because it may mean we’re going to get some relief from inflation. But at the same time, it may be bad news because it may be the result of demand destruction. Or it may be good news that the panic over the war in Russia and Ukraine and its effect on global supplies was over estimated, especially since container ships are now leaving Ukraine filled with grain and other commodities. It may be good news, and the production issues we anticipate for oil and the crop production we expected for the grain growers were overly pessimistic. Or it could be all the above. The reality is we don’t know for sure yet.
And That’s Why the Great Recession’s History Remains Relevant
What we do know is that we’ve seen this movie before 15 years ago. We know how it ends. For those willing to listen, the Great Recession and all the events surrounding it can tell us a lot about how we should react to the likely recession we’re in now.
Patience is a virtue in times like these. Patience and deliberate actions. Deliberate actions help us navigate the current market environment as safely as we can, seeking growth when prudent and shelter when needed. Patience gets us to the opportunities, which are absolutely going to be there, with as much dry powder as possible.
One deliberate action everyone should take if they haven’t already is to build a comprehensive financial plan. Build a plan that gives you the ability to stress test your financial situation through times just like the Great Recession. You can do that by using the same financial planning tool that our CFP® professionals use for our clients by clicking the “Start Planning” button below.
We can even screen share with you and walk you through it during a 20-minute “ask anything” session or complimentary consultation. We would love to help you put your plan together. All you need to do is ask, and we’ll answer.
Have a great week!
Investment advisory services offered through Modern Wealth Management, Inc., an SEC Registered Investment Adviser.
The views expressed represent the opinion of Modern Wealth Management an SEC Registered Investment Advisor. Information provided is for illustrative purposes only and does not constitute investment, tax, or legal advice. Modern Wealth Management does not accept any liability for the use of the information discussed. Consult with a qualified financial, legal, or tax professional prior to taking any action.